Download

1 / 37
380 likes | 552 Views
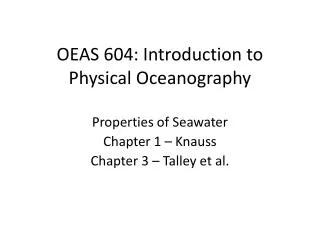
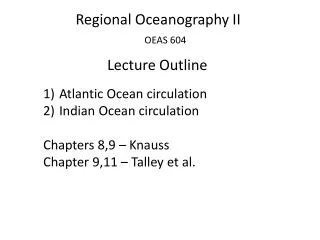
OEAS 604: Introduction to Physical Oceanography. Properties of Seawater Chapter 1 – Knauss Chapter 3 – Talley et al. Outline. Last class – overview of physical oceanography (descriptive and theoretical) Structure of water molecule and properties of water Properties of seawater

E N D
OEAS 604: Introduction to Physical Oceanography Properties of Seawater Chapter 1 – Knauss Chapter 3 – Talley et al.
Outline • Last class – overview of physical oceanography (descriptive and theoretical) • Structure of water molecule and properties of water • Properties of seawater • Salinity, temperature, density of seawater • Sound • Light
Water • Strange fluid with unexpected properties • Universal solvent • Seawater – about 96.5% is water and 3.5% is dissolved material that is an ionic solution of different salts • Water is a polar molecule • 2 hydrogen atoms (H+) and 1 oxygen atom (O=) • Many possible arrangements of atoms • linear then no net charge – electrically neutral +H -O- H+
Water Structure • Asymmetric structure • Bind hydrogen atoms at angle of about 105 degrees • Polar molecule - dipole moment results in strong forces between water molecules • Water is a polymer; molecules arrange in chains • Degree of polymerization is a function of temperature
Water Structure – arrangement of water molecules Tetrahedral Structure Quartz lattice-like Structure Ball Pack of Maximum Density Structure
Water Structure • Arrangement of water molecules • Tetrahedral structure • Quartz lattice-like structure • Ball pack of greatest density • Tetrahedral structure is less dense structure and is formed with water freezes– ice floats • Increase temperature tetrahedral crystals breakdown and water molecules move closer together to form ball pack – more dense and reaches maximum density at 4°C • Warmer temperatures water undergoes thermal expansion and is less dense - lattice structure
Water Properties • Specific heat • amount heat needed to raise a given mass by a given number of degrees • Water has high specific heat • ocean has capacity to store heat • High surface tension • supports capillary waves and allows transfer of wind energy to ocean
Seawater • Temperature, salinity (and density) are important for identifying seawater • Properties acquired at sea surface • Away from surface these are conservative properties • No internal sources or sinks – except mixing • Allows tracing of particular water masses from origin • Evaporation and precipitation change salinity • Heat transfer processes change temperature
Seawater • Complex ionic solution • Cl – 55%, Na – 32%, SO4 – 8%, Mg – 4%, K – 1% • Ratios of the weights of abundant elements are independent of total concentration • constancy of composition • Original definition – mass in grams of solid material in a kilogram of seawater after water was evaporated (absolute salinity) – determined by titration and units are part per thousand (ppt) • Salinity measured by electrical conductivity – practical salinity unit • Recent method accounts for other dissolved substances and isbased on ratio of the mass of all dissolved substances in seawater to the mass of the seawater expressed as kg/kg or g/kg - salinity has no units
Salinity Measurement Bottles for collecting water samples Autosalinometer for running salinity analyses relative to standard seawater CTD (conductivity, temperature, pressure) for measuring conductivity in a profile (deployed from ship) Talley et al. (2011)
Salinity Measurement • Chemical titration – based on chlorine ion Salinity = 1.80655 x Chlorinity • Electrical Conductivity (S,T) – practical salinity unit (1978) – based on potassium chloride standard (Natl seawater) and assumes that there are negligible variations in seawatercomposition • Absolute salinity (2010) – corrects for geographic variations in dissolved materials
Absolute salinity (TEOS-10) Absolute salinity = reference salinity + correction for other dissolved materials SA = SR + δSA δSA corrects for geographic variations in dissolved matter that does not contribute to conductivity variations: silicate, nitrate, alkalinity To convert practical salinity (Sp) to absolute salinity SR= 35.16504/35 * Sp= 1.0047*psu Reference salinity has been corrected for new knowledge (since 1978) about sea water stoichiometry as well as new published atomic weights – based on reference Atlantic seawater.
Accuracy and Precision Accuracy: reproducibility relative to a chosen standard Precision: repeatability of an observation by a given instrument or observing system A very precise measurement could be wildly inaccurate. Standard Seawater
Salinity accuracy and precision Accuracy Precision Old titration salinities (pre-1957) 0.025 psu 0.025 psu Modern lab samples relative to reference standard 0.002 psu 0.001 psu Profiling instruments without lab samples accuracy and precision to be determined Talley SIO 210 (2012)
Seawater density () Seawater density depends on S, T, and pressure = (S, T, p) units are mass/volume (kg/m3) Specific volume α = 1/ units are volume/mass (m3/kg) Pure water has a maximum density (at 4°C, atmospheric pressure) of (0,4°C,1bar) = 1000 kg/m3 = 1 g/cm3 Seawater density ranges from about 1022 kg/m3 at the sea surface to 1050 kg/m3 at bottom of ocean, mainly due to compression
Density of Seawater • Density is always ~1000 kg/m3, so common way to express density is as (“sigma”) (S, T, p) = (S, T, p) - 1000 kg/m3 • Use (S,T,0) – referred to as t – density parcel of water would have for a given T, S and evaluated at surface • The Equation of State (EOS) is nonlinear – complex dependencies that involve products of T, S, and p with themselves and with each other (i.e. terms like T2, T3, T4, S2, TS, etc.)
Seawater Density (S,T) Figure 3.1 – Talley et al.
Pressure Effects • Often omit pressure in (S, T, p) because usually compare water masses over same depth range • Pressure affects density because water is compressible – change volume and hence density • Pressure reduces volume and increases density
Pressure Effects • Pressure changes density • Lower water of 35 and 5°C adiabatically to 4000 m temperature would increase to 5.45°C due to compression • Raise water of 35 and 5°C adiabatically to surface would cool to 4.56°C due to expansion • 5°C at 4000 m is in situ temperature • 4.56°C is potential temperature
Temperature • Temperature units: Kelvin and Celsius • Kelvin is absolute temperature, with 0 K at the point of zero entropy • Celsius 0°C at melting point at standard atmosphere (and no salt, etc) • TK = TC + 273.16° • Ocean temperature range: freezing point to about 30°C to 31°C Talley SIO 210 (2012)
Potential temperature • Water (including seawater) is compressible • Compress a volume of water adiabatically (no exchange of heat or salt), then its temperature increases (“adiabatic compression”) • Potential temperatureis the temperature a parcel of water has if moved adiabatically (without heat exchanges or mixing) to the sea surface • Denoted by • Potential temperature is always lower than measured temperature except at the sea surface (where they are the same by definition)
Pressure effect on temperature:Mariana Trench (western Pacific Ocean) Measured temperature has a minimum around 4000 dbar and increases below that. Potential temperature is almost exactly uniform below 5000 m: the water column is “adiabatic”. Figure 4.9, Talley et al. Talley SIO 210 (2012)
X Temperature and potential temperature difference in S. Atlantic (25°S) Note that this water column has a temperature and potential temperature minimum at about 1000 m (must be balanced by a salinity feature). Talley SIO 210 (2012)
Atlantic temperature and potential temperature sections for contrast Temperature Potential temperature Talley SIO 210 (2012)
Sound and Light • Light (electromagnetic) and sound (mechanical) vibration exist in ocean • Ocean attenuates light more strongly than sound • Sound is a longitudinal wave – energy moves along line of propagation of wave • Speed of sound in water depends on compressibility of water and water density
Ocean acoustics: sound speed Seawater is compressible/elastic supports compressional waves or pressure waves Sound speed: β = Adiabatic compressibility of seawater if compressibility is large then Cis small if compressibility is small then C is large
Ocean acoustics • Sound is a compressional wave • Sound speed, cs,is calculated from the change in density for a given change in pressure 1/cs2 = /p at constant T, S This quantity is small if a given change in pressure creates only a small change in density (I.e. medium is only weakly compressible) • Sound speed is faster in water than in air because water is much less compressible than air
Temperature and pressure effects on sound speed • Warm water is less compressible than cold water (density decreases) • sound speed is higher in warm water • Sound speed increases with increasing temperature and salinity (non-linear) • Water at high pressure is less compressible than water at low pressure (density increases) • sound speed is higher at high pressure • These competing effects create a max. sound speed at the sea surface (warm) and a max. sound speed at great pressure, with a minimum sound speed in between • The sound speed minimum is an acoustic waveguide, called the SOundFixing and Ranging (SOFAR)channel
For station Papa in the Pacific Ocean at 39°N, 146°W, August, 1959: (a) temperature (°C) and salinity (psu) profiles, (b) corrections to sound speed due to salinity, temperature, and pressure, (c) resultant in situ sound-speed profile showing sound-speed minimum (SOFAR channel). FIGURE 3.7 Talley et al.
Sound speed c has a complicated equation of state (dependence on T, S, p), but approximately: c = 1448.96 + 4.59T – 0.053T2 + 1.34 (S – 35) + 0.016p (gives c in m/s if T in °C, S in psu, p in dbar) • c increases ~5m/s per °C • c increases ~1m/s per psu S • linear increase with pressure(depth) Typical sound speed profiles in open ocean Talley et al.
Sound ray diagrams: (a) from a shallow source for a sound-speed profile initially increasing with depth in upper mixed layer to a shallow minimum and then decreasing, and (b) from a sound source near the speed minimum in the sound channel for a typical open ocean sound-speed profile. FIGURE 3.8 Talley et al.
Light • Visible light strongly absorbed by seawater • Some of incident light is reflected (backscatter) • Major source of heat to the surface ocean through shortwave radiation
Light • Visible light strongly absorbed by seawater • Some of incident light is reflected (backscatter) • Major source of heat to the surface ocean • Attenuation of light follows exponential law
Schematic of optical processes in seawater. Adapted and simplified from Mobley (1995), with added indicators of seawater heating and photosynthesis, as well as satellite observation of ocean color. FIGURE 3.9 Talley et al.
(a) Attenuation coefficient kl, as a function of wavelength l (mm) for clearest ocean water (solid line) and turbid coastal water (dashed line). (b) Relative energy reaching 1, 10, and 50 mdepth for clearest ocean water and reaching 1 and 10 m for turbid coastal waters. FIGURE 3.10 Talley et al.
Light • Different wavelengths absorbed differently • Clear water – blue because penetrates deepest • Turbid water shifts to yellow/green wavelengths • Green water – phytoplankton • White – glacial melt • Ocean color basis for satellite remote sensing
Next Class • Stability and stratification • Chapter 2 Knauss, Chapter 3 Talley et al.