Download
1 / 31
330 likes | 649 Views
Genuine Progress Index for Atlantic Canada Indice de progrès véritable - Atlantique The Business Case for Waste Reduction Waste Reduction Week Clean Nova Scotia Breakfast with Minister Halifax, 20 October, 2004. Waste and Sustainability.

E N D
Genuine Progress Index for Atlantic CanadaIndice de progrès véritable - AtlantiqueThe Business Case for Waste ReductionWaste Reduction Week Clean Nova Scotia Breakfast with Minister Halifax, 20 October, 2004
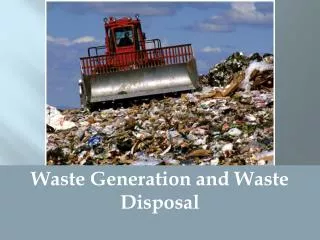
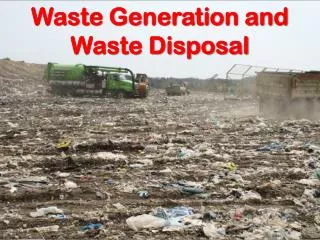
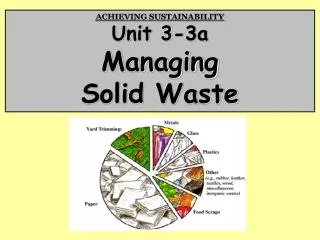
Waste and Sustainability • How we manage waste is a significant indicator of community sustainability • Capitalizing on use and reuse of waste as a resource is a key component of the efficient use of natural resources • Resource conservation, materials efficiency, waste prevention, reuse, and recycling are all integral components of a sustainable economy
GDP & Waste • Economic growth indicators do not place a value on reduced resource extraction and energy use, decreased landfill emissions and leachate contamination, or improving the quality of our air, water, and natural environment • As long as economic growth measures remain the primary benchmark of wellbeing and prosperity, waste diversion will be seen as a cost and not as the investment that it is
GPI & Waste • The GPI recognizes resource extraction, resource use, and spending to compensate for environmental damage as costs rather than gains to the economy • The GPI counts the value of what remains in our forests, oceans and other resources, not just what we extract from them, and so recognizes waste reduction initiatives as gains rather than costs to the economy
The Nova Scotia GPISolid Waste-Resource Accounts • Are the costs and benefits of the Nova Scotia solid waste resource system worth the investment? • The GPI Atlantic Solid Waste-Resource report calculates for the first time the marginal economic, social and environmental costs and benefits of solid waste-resource management in Nova Scotia
The report compares the operating and amortized capital costs of the province’s solid waste-resource system in the 1996-97 fiscal year (April 1, 1996 to March 31, 1997) and the full costs of the solid waste-resource system in the 2000-2001 fiscal year • This is the first detailed independent evaluation of the Nova Scotia solid waste-resource system and the first Canadian evaluation of a solid waste system using the full-cost accounting principles of the GPI
Full Cost-Benefit Analysis Components: Costs • Operating and amortized capital costs (including curbside pickup) • Additional time of some citizens • Nuisance (handling organic waste) • Stewardship program costs • HHW, beverage container recycling, used tire program costs • RRFB admin and operating costs
Full CBA Analysis: Benefits • Greenhouse gas and air pollutant emission reductions • Extended landfill life • Energy savings from recycling • Direct and indirect employment (part) • RRFB – diversion credits, programs • Avoided siting and liability costs • Export revenue from waste-resource goods and services • Additional Tourism
Intangible Benefits • Indicators excluded from analysis and therefore not explicitly monetized: • Aesthetic • Public health costs from pollutants emitted from extraction of virgin materials for manufacturing • Odours and noise • Social values such as health • Community pride (perception/self-image) and collective and community values
Intangible Benefits ctd. • Wildlife/nature (greater access to unspoiled, safe parklands and preserves) • Biodiversity • Reduced litter • All above excluded from CBA due to challenges of assigning monetary value • Yet value of these benefits should be acknowledged
Calculating Value & System Costs • Cost-benefit assessment compares the ‘base case’ costs (“business as usual” costs prior to the inception of the new strategy) with a full cost accounting assessment of the 2000-01 solid waste-resource system • FCA analysis determines the marginal costs and benefits between the 1996-97 fiscal year solid waste-resource system and the 2000-01 fiscal year solid waste resource system
Results • Implementation of the Solid Waste-Resource Strategy led to an increase in operating and amortized costs from $48.6 million ($53/capita) in the 1996-97 fiscal year to $72.5 million ($77/capita) in the 2000-01 fiscal year. • An increased cost of $24 million ($25/capita) for implementing the changes
Results • The new NS solid waste-resource system in 2000-01 produced net savings of at least $31.2 million, when compared to the old 1996-97 solid waste-resource system • This translates into savings of $33 for each Nova Scotian, versus a cost of $25 as suggested when comparing strictly the operating and amortized capital costs of the two systems
Benefits • Total benefits of 2000-01 system range from $79 million to $221 million =$84-$236 pp, incl: • $3.3 - $84.3 million in GHG emission reductions; • $9 - $67 million in air pollutant reductions • $18.8 million in extended landfill life • $28.6 million in energy savings from recycling • $6.5 - $8.9 million in employment benefits • $1.2 - $1.9 million in avoided liability costs • $1.1 - $1.7 million in export revenue of goods and services • $187,000 in additional tourism
Material Energy savings Paper 8.5 million Btu Plastic 20.1 million Btu Glass 2.4 million Btu Steel Cans 18.4 million Btu Aluminium Cans 166.9 million Btu Energy savings per tonne of waste recycled
Costs • Total costs of 2000-01 solid waste-resource system were $96.6-102.7 million: • $72.4 m. in operating and amortized capital costs • $14.3 m. for beverage container recycling prog. • $2.7 million for used tire management program • $1.6 million in RRFB operating and admin costs • $5 - $9.5 million to increase participation • $220,000 - $1.8 million in nuisance costs
Conclusions 1995 NS Solid Waste-Resource Strategy has led to a considerable net benefit, both in monetary and non-monetary terms: 1) The solid waste-resource system in 2000-01, despite increased operating and amortized capital costs, provided a net savings of between $31 million and $167.7 million compared to the operating and amortized capital costs of the old system
Conclusions 2) Nova Scotia is a leader both internationally and nationally in solid waste diversion. 3) The accessibility, comprehensiveness, and levels of waste being composted and recycled have all improved since the introduction of the Solid Waste-Resource Strategy.
Genuine Progress • Access to curbside recycling in Nova Scotia jumped from less than 5% in 1989 to 99% today • 76% of residents now have access to curbside organics pickup • Both are by far the highest rates in the country
Comparisons • On a per capita basis, Nova Scotia disposes of 39% less waste than Canadian average • HRM has the highest waste diversion rate of any municipality in Canada – twice the average. • Nova Scotia’s overall waste diversion rate of 46% is also higher than any industrialised country. • Nova Scotia's high diversion rate is due in large part to its composting system.
Challenges • Back-sliding: NS: 1989 = 3% diversion; 2000 = 50%; 2003 = 46% • HRM decreased from around 50% to 47%. • Inadequacy of systems for household hazardous waste and construction and demolition waste (25-30% of the waste stream) • Inadequate waste diversion in apartment buildings and businesses • Need expansion of waste stewardship agreements with businesses
What can businesses do? • Sydney Olympics demonstrated that compostable coffee cups can be successfully used on very large scale. In NS, Irving Oil, Just Us use biodegradable coffee cups. But biggest purveyors of coffee in Nova Scotia still don’t use recyclable or compostable coffee cups. • Litter study found Tim Horton’s and MacDonald’s alone account for one-third of all litter in NS –22% and 10.1% resp. Efforts by the NS DEL to encourage Tim Horton’s to use compostable or recyclable coffee cups are ongoing
In the long term • If we really want to reduce waste further, we need to reduce the amount of waste we generate in the first place – by re-examining consumption habits and reducing unnecessary packaging. • A Zero Waste Council a good first step – with business, NGOs, government
How we manage our waste affects the kind of Nova Scotia we leave our children?
Genuine Progress Index for Atlantic CanadaIndice de progrès véritable - Atlantique www.gpiatlantic.org