Download
1 / 54
540 likes | 682 Views
Sex Differences in Overweight & Obesity. http://www.cdc.gov. Age Differences in Overweight & Obesity. http://www.cdc.gov. Race Differences in Overweight & Obesity. http://www.cdc.gov. ENDOCRINE ADIPOCYTE. PAI-1. TNF- α. Adipisn. IL-6. Adiponectin. MCP-1. Resistin. Angiotensin.

E N D
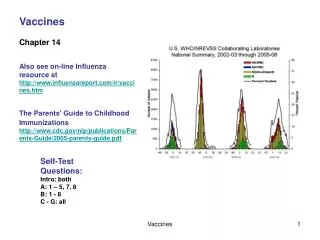
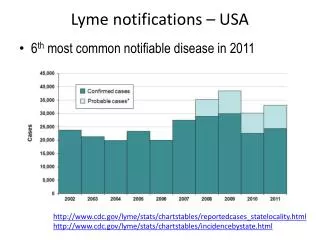
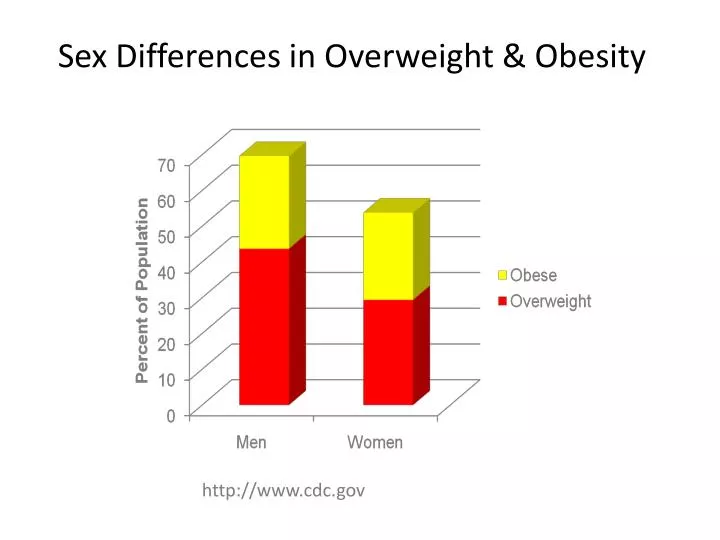
Sex Differences in Overweight & Obesity http://www.cdc.gov
Age Differences in Overweight & Obesity http://www.cdc.gov
Race Differences in Overweight & Obesity http://www.cdc.gov
ENDOCRINE ADIPOCYTE PAI-1 TNF-α Adipisn IL-6 Adiponectin MCP-1 Resistin Angiotensin Leptin
RECEPTORS FOUND ON ADIPOCYTE Thyroid Stimulating Hormone Insulin Glucagon Growth Hormone Β1,β2,β3, α1, α2 Leptin Androgen Angiotensin II Estrogen Glucagon Like Peptide-1 Thyroid Hormone Gastrin TNF-α Glucocorticoid IL-6 Vit D
Hypothalamic-pituitary –adrenal axis Hypothalamic -pituitary-thyroid axis Hypothalamic-pituitary -gonadal axis ↑ Satiety ↑ Energy Expenditure ↑glucose uptake ↑ glucose metabolism ↑ Glucose Production ↑ Insulin • β3 • Androgens • FFA • Growth Hormone • Peroxisome proliferator-activity receptor γ agonists • Insulin • Glucocorticoids • TNFα • Estrogens • CCAAT/enhancer-binding protein α Leptin
Macrophage & Monocyte Chemoattractant Protein -1 ↑ TNFα ↑ IL-6 ↑Insulin Resistance Inhibits Adipocyte growth MPC-1
↑Insulin Resistance ↑ FFA Production ↑ Cholesterol Synthesis ↑ Insulin Resistance ↓ Glucose Uptake ↓ FFA Storage ↑Macrophage Infiltration ↑Insulin Resistance TNFα
IL-6 deficiency in CNS alerting energy homeostasis ↓ energy expenditure ↑ Insulin Resistance ↑ Hyperlipidemia ↑Insulin Resistance ↑ Glucose Production ↑Macrophage Infiltration ↑Insulin Resistance IL-6
TNFα PAI-1
↑ NO production • ↑anti-inflammatory activities • ↑ anti-adhesion activities ↓Triglyceride Production ↑ FFA Oxidation ↓Glucose Production ↓ FFA Synthesis • Insulin Resistance • Insulin Sensitivity Adiponectin
↑ FFA Uptake ↑ Triglyceride Synthesis ↓ Lipolysis ↑Acylation Stimulating Protein (ASP) ↑ Insulin Secretion ↑ Glucose Transport ↑ Triglyceride Synthesis ↓ Lipolysis ↓ FFA release Adipisn
↑insulin resistance ↑ Insulin Resistance ↑Insulin Resistance Resistin
Vasoconstriction ↓ lipolysis ↑ lipogenesis ↑ Insulin Resistance ↑ gluconeogenesis ↑ glycogenolysis ↑ Fluid Reabsorption ACE Inhibitor ↑Adipogenesis Renin Angiotensin System (RAS)
Steroidogenic Enzymes Sex Steroids Glucocorticoids • Androgens → Estrogens • Androstenedione → Testosterone • Estrone → Estrodiol • Insulin Sensitivity • Visceral Adipose Deposition
Subcuteanous Fat Deposit Visceral Fat Deposit
BODY MASS INDEX (BMI) MEN >27.8 kg/m2 WOMEN >27.3 kg/m2
Waist to Hip Ratio Upper Body Obesity Men >0.85 Women >0.84 Lower Body Obesity Men <0.80 Women <0.76
Increased Risk, Relative to Normal Weight and waist circumference Obesity BMI Men<102 cm Men >102 cm Class Women <88cm Women >88 cm Underweight <18.5 Normal 18.5-29.9 Overweight 35.0-29.9 Increased High Obesity I 30-34.5 High Very High Obesity II 35.0-39.3 Very High Very High Extreme Obesity >40.0 Extremely High Extremely High
PERCENT BODY FAT FOR HEATLH Category Men Women Minimal <5% 8% Below Ave 6-15% 15-23% Above Ave 16-25% 24-32% At Risk >25% >32% Lohman, Advances in Body Composition Assessment, Human Kinetics, 1992.
* * * Wallace, J et al Am J of Human Biology 6:699-709, 1994.
No Data <10% 10%–14% Obesity Trends* Among U.S. AdultsBRFSS, 1985 (*BMI ≥30, or ~ 30 lbs overweight for 5’ 4” woman)
No Data <10% 10%–14% Obesity Trends* Among U.S. AdultsBRFSS, 1986 (*BMI ≥30, or ~ 30 lbs overweight for 5’ 4” woman)
No Data <10% 10%–14% Obesity Trends* Among U.S. AdultsBRFSS, 1987 (*BMI ≥30, or ~ 30 lbs overweight for 5’ 4” woman)
No Data <10% 10%–14% Obesity Trends* Among U.S. AdultsBRFSS, 1988 (*BMI ≥30, or ~ 30 lbs overweight for 5’ 4” woman)
No Data <10% 10%–14% Obesity Trends* Among U.S. AdultsBRFSS, 1989 (*BMI ≥30, or ~ 30 lbs overweight for 5’ 4” woman)
No Data <10% 10%–14% Obesity Trends* Among U.S. AdultsBRFSS, 1990 (*BMI ≥30, or ~ 30 lbs overweight for 5’ 4” woman)
No Data <10% 10%–14% 15%–19% Obesity Trends* Among U.S. AdultsBRFSS, 1991 (*BMI ≥30, or ~ 30 lbs overweight for 5’ 4” woman)
No Data <10% 10%–14% 15%–19% Obesity Trends* Among U.S. AdultsBRFSS, 1992 (*BMI ≥30, or ~ 30 lbs overweight for 5’ 4” woman)
No Data <10% 10%–14% 15%–19% Obesity Trends* Among U.S. AdultsBRFSS, 1993 (*BMI ≥30, or ~ 30 lbs overweight for 5’ 4” woman)
No Data <10% 10%–14% 15%–19% Obesity Trends* Among U.S. AdultsBRFSS, 1994 (*BMI ≥30, or ~ 30 lbs overweight for 5’ 4” woman)
No Data <10% 10%–14% 15%–19% Obesity Trends* Among U.S. AdultsBRFSS, 1995 (*BMI ≥30, or ~ 30 lbs overweight for 5’ 4” woman)
No Data <10% 10%–14% 15%–19% Obesity Trends* Among U.S. AdultsBRFSS, 1996 (*BMI ≥30, or ~ 30 lbs overweight for 5’ 4” woman)
No Data <10% 10%–14% 15%–19% ≥20 Obesity Trends* Among U.S. AdultsBRFSS, 1997 (*BMI ≥30, or ~ 30 lbs overweight for 5’ 4” woman)
No Data <10% 10%–14% 15%–19% ≥20 Obesity Trends* Among U.S. AdultsBRFSS, 1998 (*BMI ≥30, or ~ 30 lbs overweight for 5’ 4” woman)
No Data <10% 10%–14% 15%–19% ≥20 Obesity Trends* Among U.S. AdultsBRFSS, 1999 (*BMI ≥30, or ~ 30 lbs overweight for 5’ 4” woman)
No Data <10% 10%–14% 15%–19% ≥20 Obesity Trends* Among U.S. AdultsBRFSS, 2000 (*BMI ≥30, or ~ 30 lbs overweight for 5’ 4” woman)
Obesity Trends* Among U.S. AdultsBRFSS, 2001 (*BMI ≥30, or ~ 30 lbs overweight for 5’ 4” woman) No Data <10% 10%–14% 15%–19% 20%–24% ≥25%
Obesity Trends* Among U.S. AdultsBRFSS, 2002 (*BMI ≥30, or ~ 30 lbs overweight for 5’ 4” woman) (*BMI 30, or ~ 30 lbs overweight for 5’4” person) No Data <10% 10%–14% 15%–19% 20%–24% ≥25% Source: Behavioral Risk Factor Surveillance System, CDC
Obesity* Trends Among U.S. AdultsBRFSS, 2003 (*BMI ≥30, or ~ 30 lbs overweight for 5’ 4” person) No Data <10% 10%–14% 15%–19% 20%–24% ≥25%
Obesity Trends* Among U.S. AdultsBRFSS, 2004 (*BMI ≥30, or ~ 30 lbs. overweight for 5’ 4” person) No Data <10% 10%–14% 15%–19% 20%–24% ≥25%
Obesity Trends* Among U.S. AdultsBRFSS, 2005 (*BMI ≥30, or ~ 30 lbs. overweight for 5’ 4” person) No Data <10% 10%–14% 15%–19% 20%–24% 25%–29% ≥30%
Obesity Trends* Among U.S. AdultsBRFSS, 2006 (*BMI ≥30, or ~ 30 lbs. overweight for 5’ 4” person) No Data <10% 10%–14% 15%–19% 20%–24% 25%–29% ≥30%
Obesity Trends* Among U.S. AdultsBRFSS, 2007 (*BMI ≥30, or ~ 30 lbs. overweight for 5’ 4” person) No Data <10% 10%–14% 15%–19% 20%–24% 25%–29% ≥30%
Obesity Trends* Among U.S. AdultsBRFSS, 2008 (*BMI ≥30, or ~ 30 lbs. overweight for 5’ 4” person) No Data <10% 10%–14% 15%–19% 20%–24% 25%–29% ≥30%
Obesity Trends* Among U.S. AdultsBRFSS,1985, 1996, 2006 (*BMI 30, or about 30 lbs overweight for 5’4” person) 1996 1985 2006 No Data <10% 10%–14% 15%–19% 20%–24% ≥25%
OVEREATING STUDIES (individual subjects) Salans, L.B., et al. Journal of Clinical Investigation 50:1005-1011, 1971.
OVEREATING STUDIES (individual subjects) Salans, L.B., et al. Journal of Clinical Investigation 50:1005-1011, 1971.
OVEREATING STUDIES (individual subjects) Salans, L.B., et al. Journal of Clinical Investigation 50:1005-1011, 1971.