Download
1 / 6
60 likes | 68 Views
Variations of the LER beam size in X and Y as fctn of HER during the LER=1.2A Her scan. X LER size as fctn of HER. Y LER size as fctn of HER. Very good correlation between the BLLC2081 variation and the LER beam sizes (1). LER Y beam size as fct of HER. BLSC2081 as fct of HER.

E N D
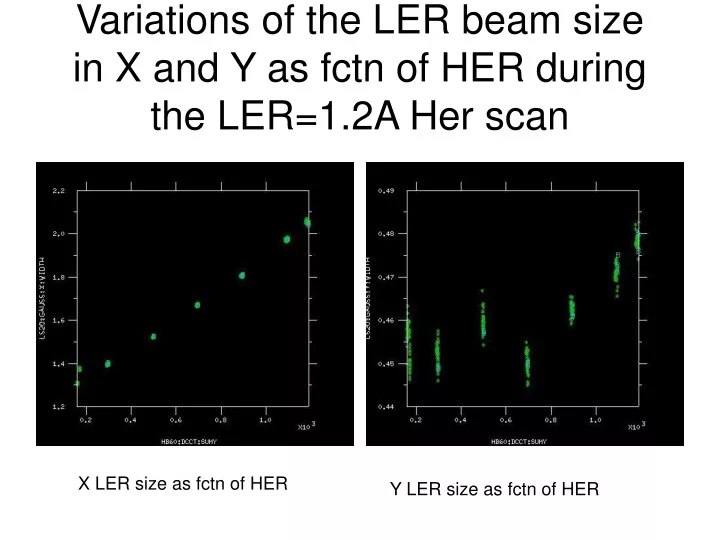
Variations of the LER beam sizein X and Y as fctn of HER during the LER=1.2A Her scan X LER size as fctn of HER Y LER size as fctn of HER
Very good correlation between the BLLC2081 variation and the LER beam sizes (1) LER Y beam size as fct of HER BLSC2081 as fct of HER
Very good correlation between the BLLC2081 variation and the LER beam sizes (2) BLLC 2081 as fct of LER Ybeam size
LER beam sizes as fct of HERcurrent at LER=1.89A X LER beam size as fct of HER Y LER beam size as fct of HER
Very good correlation between BLSC2081 and 1/(sigx.sigy) BLSC2081 Variation of BLSC2081 as fctn of 1/sigx.sigy (fitted) LER=1.89A 1/sigx.sigy (fitted)
Conclusion • The decrease of the counting rate in BLLC2081 when HER increases at fixed LER current can be tracked back to the increase of LER X and Y beam sizes. This is the signature of the Touschek effect.