Download

1 / 23
230 likes | 317 Views
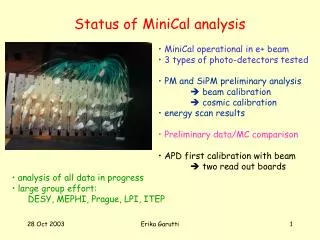
Status of MiniCal analysis. MiniCal operational in e+ beam 3 types of photo-detectors available PM and SiPM preliminary analysis beam calibration cosmic calibration energy scan results Preliminary data/MC comparison APD first calibration with beam.

E N D
Status of MiniCal analysis • MiniCal operational in e+ beam • 3 types of photo-detectors available • PM and SiPM preliminary analysis • beam calibration • cosmic calibration • energy scan results • Preliminary data/MC comparison • APD first calibration with beam • analysis of all data in progress • large group effort: • DESY, MEPHI, Prague, LPI, ITEP Erika Garutti
e+ 1-6 GeV The MiniCal 3x3 tiles per layer Tile: 5x5x0.5 cm3 97% Shower contained e+ 1 cell = 3 tiles combined in depth Erika Garutti
Silicon PhotoMultiplier (SiPM) MEPhI&PULSAR SiPM Pixels of the SiPM Test of 3 types of Photo-Detectors • MA-PM –16 channels: • best photo-detector • cannot be operated in B • cell read out: 3 tiles connected to one channel Only for reference • Silicon photo-multiplier (SiPM): • new detector concept, first test with beam • sizes: 1x1mm2, 1000 pixels/mm2 • gain ~ 2*106, quantum eff. ~ 15-20% • single tile read out / mounted directly on tile • Avalanche photo-detector (APD): • already used by CERN experiments • gain ~ 500, quantum eff. ~ 75% • cell read out: 3 tiles Erika Garutti
PM Calibration with beam • Beam calibration - individual tiles - cell of 3 tiles e+ Good reproducibility - independent on material in front - independent on repositioning Analysis from Evgeni Devitsin, LPI Erika Garutti
Single tile calibration Sum of single tile calibration compared to cell calibration - 108 tiles+WLF tested with source 7% spread • 108 tile+WLF+PM • 16% spread Analysis from Evgeni Devitsin, LPI Erika Garutti
Cell calibration Analysis from Evgeni Devitsin, LPI Erika Garutti
Cell calibration Analysis from Evgeni Devitsin, LPI Erika Garutti
Cell calibration Analysis from Evgeni Devitsin, LPI Erika Garutti
PM Calibration with cosmics m • Cosmic ray calibration - cell of 3 tiles m MIP position fitted with gauss+landau • MPV cosmic shifted with respect to MPV e+ Analysis from Evgeni Devitsin Erika Garutti
PM Calibration Cell of 3 tiles single tile Ped: 21.6 , s: 1.1 MIP: 81.1 <RMS>: 7.7 +/- 4.9 Ped: 21.3 , s: 0.9 MIP: 37.7 <RMS>: 8.4 +/- 1.3 Ped: 21.2 , s: 1.0 MIP: 36.6 <RMS>: 12.8 +/- 1.8 Ped: 20.5 , s: 1.5 MIP: 76.3 <RMS>: 10.5 +/- 6.2 Analysis from Evgeni Devitsin, LPI Erika Garutti
Shower development in PM 3 Gev e+ beam • 97% shower contained in central tiles • 13 layers ~ 14 X0 Erika Garutti
Energy Resolution for PM readout Energy Sum • pedestal due to noise trigger reduced bump due to second particle in same trigger • different calib. lead to same dE/E • 5% systematic uncertainty Erika Garutti
SiPM Calibration Single photoelectron peak visible with pre-amplifier for calibration only One photoelectron peak MIP peak pedestal From MEPHI group (E. Popova) See A. Karakash talk Erika Garutti
Shower development in SiPM Single layer readout 1 MIP peak visible in first layer Tile 2 Tile 1 Tile 3 Tile 4 Tile 5 Tile 6 Tile 7 Tile 8 95% shower contained for 3GeV beam Tile 10 Tile 9 Erika Garutti
Energy Resolution for SiPM Energy Sum • - non-linearity correction not applied • 5% systematic uncertainty • GEANT3 with SiPM (see talk A. Raspereza) 1 GeV 2 GeV 4 GeV 3 GeV 5 GeV 6 GeV Preliminary E [MeV] Erika Garutti
Result Comparison • good agreement PM/SiPM • systematic uncertainty still to be • calculated (fix 5%) • SiPM non-linearity correction • both MC w/o tile LY variation ~7% • GEANT 3 with Poisson treatment • of ph.e. (SiPM) Erika Garutti
APD Calibration • - tile calibration with source • correction factor for each cell ~ 20% spread (corrected) • 14 APD connected to cells of 3 tiles • tested with 3 GeV beam, no absorbers • Preamp from Prague (Ivo) • APD values for MIP calibration: Ped: 18.9 , s: 9.9 MIP: 54.1 , RMS: 19.6 <RMS>: 17.2+/- 1.6 Compare to PM values: Ped: 20.5 , s: 1.5 MIP: 76.3 <RMS>: 10.5 +/- 6.2 Erika Garutti
APD Calibration special PreAmp settings T = 29 C 400 V : 20% spread for 10 APD 420 V : 26% spread for 10 APD result from CERN test: 28% spread for the same APD T = 25 C Erika Garutti
APD Voltage dependence • T = 29 C (stable) • exponential increase of gain • - smaller increase than observed at CERN APD test at CERN T = 25 C Erika Garutti
PreAmp Settings PreAmp conversion resistor: standard 1 k 2 k 0.5 k 1 k 10 k Erika Garutti
LED monitoring PIN diode Stability ~1% PM 2 550V LED position corrected for ped. and PIN diode fluctuations: Stability ~1% PM 3 500V from H. Meyer • LED monitoring system seams reliable • longer monitoring time needed Erika Garutti
Outlook • Finish tests for all photo-detectors • Finalize data analysis + MC comparison • LCIO format for data acquisition • fast comparison to MC • fast integration of other detectors • first hardware in this format !!! • October: Test of ECAL/HCAL DAQ with the MiniCal 2004 construction and operation of the Physics Prototype Erika Garutti
APD test at CERN Characteristics of 40 APD tested @ CERN (CMS test room): • quantum efficiency = 77.5% (500nm) • stable at 1% level • capacitance ~30pF at 400V • gain vs voltage • variation of ~5V at fixed gain • Variation of dM/dV: With power supply stability ~10-3 10% gain variation(@ gain 500) Temperature stability ~1oC high sensitivity to T variation Erika Garutti