Download
1 / 15
160 likes | 173 Views
Measurement of Pressure Distribution and Lift for an Airfoil. Purpose Test design Measurement system and Procedures Instrumentation Data reduction Data acquisition Uncertainty Analysis. Purpose. Examine the surface pressure distribution on a Clark-Y airfoil

E N D
Measurement of Pressure Distribution and Lift for an Airfoil Purpose Test design Measurement system and Procedures Instrumentation Data reduction Data acquisition Uncertainty Analysis
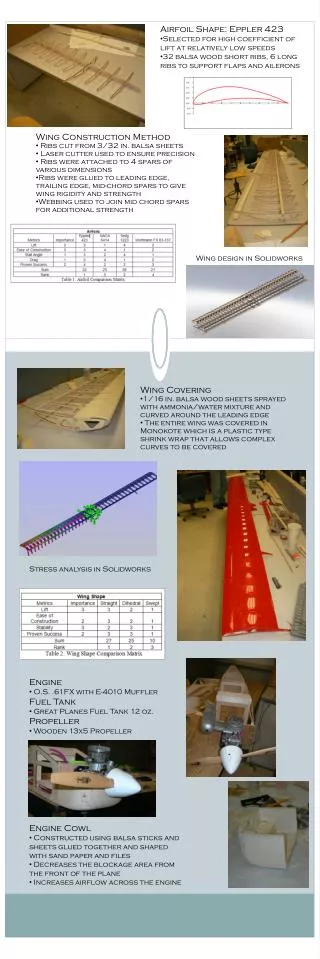
Purpose • Examine the surface pressure distribution on a Clark-Y airfoil • Compute the lift and drag forces acting on the airfoil • Specify the flow Reynolds number • Compare the results with benchmark data • Uncertainty analysis for • Pressure coefficient • Lift coefficient
Test Design • Facility consists of: • Closed circuit vertical wind tunnel. • Airfoil • Load cell • Temperature sensor • Automated data acquisition system
Test Design (contd.) Airfoil(=airplane surface: as wing) is placed in test section of a wind tunnel with free-stream velocity of 15 m/s. This airfoil is exposed to: • Forces acting normal to free stream = Lift • Forces acting parallel to free stream = Drag Only two dimensional airfoils are considered: Top of Airfoil: • The velocity of the flow is greater than the free-stream. • The pressure is negative Underside of Airfoil: • Velocity of the flow is less than the the free-stream. • The pressure is positive This pressure distribution contribute to the lift
Measurement systems Instrumentation • Protractor – angle of attack • Resistance temperature detectors (RTD) • Pitot static probe – velocity • Scanning valve – scans pressure ports • Pressure transducer (Validyne) • Digital Voltmeter (DVM) • Load cell – lift and drag force
Data reduction In this experiment, the lift force, L on the Airfoil will be determined by integration of the measured pressure distribution over the Airfoil’s surface. The figure shows a typical pressure distribution on an Airfoil and its projection .
Data reduction Calculation of lift and drag forces • The lift force L is determined by integration of the measured pressure distribution over the airfoil’s surface. • It is expressed in a dimensionless form by the pressure coefficient Cp where, pi = surface pressure measured, = P pressure in the free-stream • The lift force is also measured using the load cell and data acquisition system directly. U = free-stream velocity, r = air density ( temperature), pstagnation = stagnation pressure measured at the tip of the pitot tube, L = Lift force, b = airfoil span, c = airfoil chord
mass (kg) Volts 0 -0.021 0.295 -0.1525 0.415 -0.203 0.765 -0.3565 1.31 -0.5935 1.635 -0.7385 Calibration of load cell Program output Calibration program Curve fitting method
Data acquisition Setting up the initial motor speed Visualization of wind tunnel conditions
Data needed: Observation point list Sampling Rate Settling Time Length of each Sample Angle of attack Data acquisition (contd.) Airfoil pressure visualization
Calculation of lift force Program to measure lift force in volts
Uncertainty analysis Pressure coefficient Lift coefficient
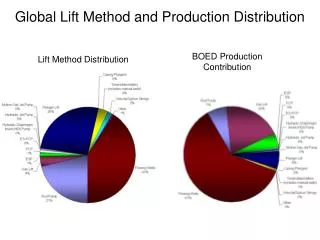
Benchmark data Reference data for CL • a) Distribution of the pressure coefficients for • = 0, 6, 13, 16 and Re = 300,000; , Benchmark data Reference data for CD