Download
1 / 15
150 likes | 308 Views
The Soil Moisture Active/Passive (SMAP) Mission: Monitoring Soil Moisture and Freeze/Thaw State. John Kimball,. NTSG, The University of Montana. Global Vegetation Workshop, June 16-19 2009. SMAP Science Objectives.

E N D
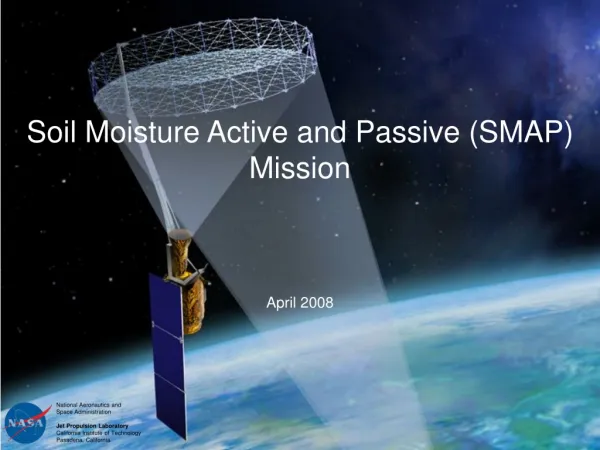
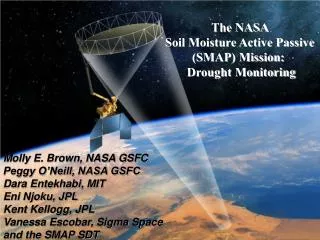
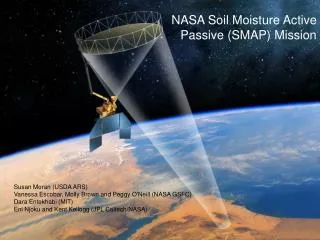
The Soil Moisture Active/Passive (SMAP) Mission: Monitoring Soil Moisture and Freeze/Thaw State John Kimball, NTSG, The University of Montana Global Vegetation Workshop, June 16-19 2009
SMAP Science Objectives SMAP is one of the four first-tier missions recommended by the NRC Earth Science Decadal Survey Report Primary Science Objectives: • Global, high-resolution mapping ofsoil moisture and its freeze/thaw state to: • Link terrestrial water, energy and carboncycle processes • Estimate global water and energy fluxes at the land surface • Quantify net carbon flux in boreal landscapes • Extend weather and climate forecast skill • Develop improved flood and drought prediction capability Soil moisture and freeze/thaw state are major constraints to land-atmosphere energy, water & carbon exchange Source: Nemani et al. 2003. Science 300
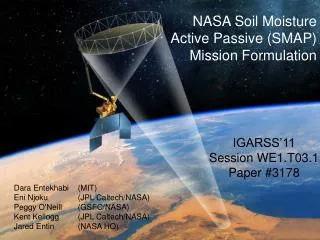
SMAP Instrument & Mission Overview • Science Measurements • Soil moisture and freeze/thaw state • Orbit: • Sun-synchronous, 6 am/6pm equatorial crossing • 670 km altitude • Instruments: • L-band (1.26 GHz) radar • Polarization: HH, VV, HV • SAR mode: 1-3 km resolution (degrades over center 30% of swath) • Real-aperture mode: 30 x 6 km resolution • L-band (1.4 GHz) radiometer • Polarization: V, H, U • 40 km resolution • Instrument antenna (shared by radar & radiometer) • 6-m diameter deployable mesh antenna • Conical scan at 14.6 rpm • incidence angle: 40 degrees • Creating Contiguous 1000 km swath • Swath and orbit enable 2-3 day revisit • Mission Ops duration: 2013 launch; 3 year baseline SMAP has significant heritage from Hydros ESSP mission concept and Phase A studies
Campbell Yolo Clay Field Experiment Site, California Soil Evaporation Normalized by Potential Evaporation Surface Soil Moisture [% Volume] Measured by L-Band Radiometer “Link Terrestrial Water, Energy and Carbon Cycle Processes” Water and Energy Cycle Carbon Cycle Soil Moisture Controls the Rate of Continental Water and Energy Cycles Landscape Freeze/Thaw Dynamics Constrain the Boreal Carbon Balance Do Climate Models Correctly Represent the Land surface Control on Water and Energy Fluxes? What Are the Regional Water Cycle Impacts of Climate Variability? Are Northern Land Masses Sources or Sinks for Atmospheric Carbon?
ΔT ΔSM 0 0 “Estimate Global Water and Energy Fluxes at the Land Surface” • IPCC models currently exhibit large differences in soil moisture trends under simulated climate change scenarios • Projections of summer soil moisture change (ΔSM) show disagreements in Sign among IPCC AR4 models SMAP soil moisture observations will help constrain model parameterizations of surface fluxes and improve model performance Relative soil moisture changes (%) in IPCC models for scenario from 1960-1999 to 2060-2099 Li et al., (2007): Evaluation of IPCC AR4 soil moisture simulations for the second half of the twentieth century, Journal of Geophysical Research, 112.
Growing season onset from atmospheric CO2 samples (difference from multi-year mean, days) Thaw day difference from multi-year mean (days) Primary thaw day (DOY) “Quantify Net Carbon Flux in Boreal Landscapes” SMAP will provide important information on environmental constraints to land-atmosphere carbon source/sink dynamics. It will provide more than 8-fold increase in spatial resolution over existing moderate resolution microwave sensors. Mean growing season onset for 1988 – 2002 derived from coarse resolution SSM/I data Annual comparison of pan-Arctic thaw date and high latitude growing season onset inferred from atmospheric CO2 concentrations, 1988 – 2001 McDonald et al. (2004): Variability in springtime thaw in the terrestrial high latitudes: Monitoring a major control on the biospheric assimilation of atmospheric CO2 with spaceborne microwave remote sensing. Earth Interactions 8(20), 1-23.
“Extend Weather and Climate Forecast Skill” Predictability of seasonal climate is dependent on boundary conditions such as sea surface temperature (SST) and soil moisture – Soil moisture is particularly important over continental interiors. 24-Hours Ahead High-Resolution Atmospheric Model Forecasts Prediction driven by SST Difference in Summer Rainfall: 1993 (flood) minus 1988 (drought) years Without Realistic Soil Moisture Observations Prediction driven by SST and soil moisture Buffalo Creek Basin Observed Rainfall 0000Z to 0400Z 13/7/96 (Chen et al., 2001) (Schubert et al., 2002) With Realistic Soil Moisture High resolution soil moisture data will improve numerical weather prediction (NWP) over continents by accurately initializing land surface states -5 0 +5 Rainfall Difference [mm/day]
“Develop Improved Flood and Drought Prediction Capability” “…delivery of flash-flood guidance to weather forecast offices are centrally dependent on the availability of soil moisture estimates and observations.” “SMAP will provide realistic and reliable soil moisture observations that will potentially open a new era in drought monitoring and decision-support.” Decadal Survey: Operational Drought Indices Produced by NOAA and National Drought Mitigation Center (NDMC) NOAA National Weather Service Operational Flash Flood Guidance (FFG) • Current Status: Indirect soil moisture indices are based on rainfall and air temperature • (by county or ~30 km) • SMAP Capability: Direct soil moisture measurements – global, 3-day, 10 km resolution
Satellite Global Biospheric Monitoring & The Problem with Clouds…
SMAP Science, Instrument and Mission Requirements SMAP requirements were developed under Hydros and refined through extensive community interaction - The July ’07 NASA SMAP Science Workshop confirmed that these requirements satisfy the SMAP mission science objectives
Baseline Science Data Products Global Mapping L-Band Radar and Radiometer High-Resolution and Frequent-Revisit Science Data Observations + Models = Value-Added Science Data
SMAP L4_Carbon product: Land-atmosphere CO2 exchange • Motivation/Objectives: Quantify net C flux in boreal landscapes; reduce uncertainty regarding missing C sink on land; • Approach: Apply a soil decomposition algorithm driven by SMAP L4_SM and GPP inputs to compute land-atmosphere CO2 exchange (NEE); • Inputs: Daily surface (<5cm) soil moisture & T (L4_SM) & GPP (MODIS/NPP); • Outputs: NEE (primary/validated); Reco & SOC (research/optional); • Domain: Vegetated areas encompassing boreal/arctic latitudes (≥45°N); • Resolution: 10x10 km; • Temporal fidelity: Daily (g C m-2 d-1); • Latency: Initial posting 12 months post-launch, followed by14-day latency; • Accuracy: Commensurate with tower based CO2 Obs. (RMSE ≤ 30 g C m-2 yr-1).
L4_C algorithm using MODIS - AMSR-E inputs BIOME-BGC simulations using local meteorology Tower CO2 eddy flux measurement results >7 4 2 0 -2 -4 <-7 NEE (g C m-2) DOY 177, 2004 Prototype L4_C Product Example Mean Daily net CO2 Exchange (NEE) NEE for NSA-OBS Ameriflux Site C source (+) C sink (-) L4_C application using MODIS GPP (MOD17) & AMSR-E (SM & T) inputs. The graph (above) shows 2004 seasonal pattern of daily NEE for a mature boreal conifer stand from L4_C, ecosystem model and tower measurements. SMAP L4_C resolution/sampling will allow characterization of surface processes approaching scale & accuracy of tower flux measurements: ~10km resolution, daily repeat, NEE ≤ 30 g C m-2 yr-1 RMSE. Source: Kimball et al. 2009 TGARS 47.
SMAP Calibration and Validation activities Pre-launch L4_C Test using MODIS & AMSR-E Inputs Pre-launch (2009-2013): - Development, testing & selection of baseline algorithms; - Development of algorithm software test-bed for algorithm testing & sensitivity studies; - Verify algorithm sensitivity & accuracy requirements using available satellite, in situ and model based data & targeted field campaigns; - Initialization/calibration/optimization of algorithm parameters (e.g. BPLUT, SOC pools); Post-launch (2013-2015): - Verify product accuracy through focused field campaigns and global observation networks; - Model assimilation based value assessment (GMAO, TOPS, CarbonTracker); Kimball et al. TGARS 2009 Global Biophysical Station Networks
Opportunities for Community Involvement • Community workshops (Events) • SMAP SDT Working Groups (Team): • - Algorithms • - Calibration & Validation • - Applications http://smap.jpl.nasa.gov/