Download
1 / 83
980 likes | 1.36k Views
Aquatic Biodiversity. Chapter 8. Core Case Study: Why Should We Care about Coral Reefs?. Biodiversity Important ecological and economic services Natural barriers protecting coasts from erosion Provide habitats Support fishing and tourism businesses Provide jobs Studied and enjoyed.

E N D
Aquatic Biodiversity Chapter 8
Core Case Study: Why Should We Care about Coral Reefs? • Biodiversity • Important ecological and economic services • Natural barriers protecting coasts from erosion • Provide habitats • Support fishing and tourism businesses • Provide jobs • Studied and enjoyed
Human Activities Are Disrupting and Degrading Marine Systems • Major threats to marine systems • Coastal development • Overfishing • Runoff of nonpoint source pollution • Point source pollution
Human Activities Are Disrupting and Degrading Marine Systems • Major threats to marine systems • Habitat destruction • Introduction of invasive species • Climate change from human activities • Pollution of coastal wetlands and estuaries
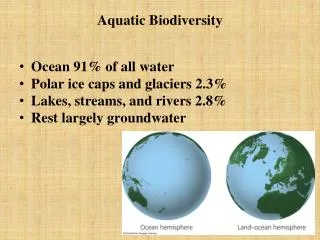
Earth: The Watery Planet • 71% Earth covered by ocean • 2.2% covered by freshwater
What are Earth’s Major Oceans? • Pacific • Largest, deepest • Atlantic • Second largest • Indian • Mainly in Southern Hemisphere • Arctic • Smallest, shallowest, ice-covered
Pelagic Intertidal Abyssal Benthic
Most Aquatic Species Live in Top, Middle, or Bottom Layers of Water • Plankton • Phytoplankton • Zooplankton • Ultraplankton • Nekton • Benthos • Decomposers
Measuring Primary Production • Satellites measure differences in sea surface color • Color = type of producer • Green color = chlorophyll pigments
Eutrophication • Light Availability – depth, season, latitude • Little photosynthesis below 100m (330ft) • Phytoplankton productivity limited to photic zone
Eutrophication • Nutrient Availability – “Natural fertilizer” • Upwelling - aids primary production by bringing nutrients to surface • Nitrogen and Phosphorous • Caused by winds blowing either parallel or offshore along a coastline • Brings up cold nutrient-rich water
Eutrophication • Nutrient Availability – “Natural fertilizer” • Zooplankton (fecal pellets, death) – leads to future phytoplankton blooms • Need bacteria to decompose waste
Red Tide Impacts • Toxic to marine life: accumulates in clams, mussels, scallops, fish, mammals • Death to some species; biomagnification • Human poisoning after consumption (30 min.) • Symptoms: • Paralytic: paralysis, asthma, heartattack (rare) • Neurotoxic: tingling, paralysis, memory loss • Diarrhetic: cramps, vomiting, diarrhea
What is turbidity? • Measure of the degree to which the water looses its transparency • Due to the presence of suspended particulates
What causes turbidity? • There are various parameters influencing the cloudiness of the water. Some of these are: • Phytoplankton • Sediments from erosion • Resuspended sediments from the bottom (frequently stir up by bottom feeders like carp) • Waste discharge • Algae growth • Urban runoff
What are the consequences of high turbidity? • Suspended particles absorb heat from the sunlight • Turbid waters become warmer • Reduce the concentration of oxygen in the water
What is Dissolved Oxygen? • Amount of gaseous oxygen (O2) dissolved in an aqueous solution. • Oxygen gets into water by: • Diffusion from the surrounding air • Aeration (rapid movement) • Waste product of photosynthesis
Environmental Impact • Should not exceed 110 % • Concentrations above this level can be harmful to aquatic life.
Gas Bubble Disease • Fish in waters containing excessive dissolved gases • Bubbles block the flow of blood through blood vessels causing death • External bubbles (emphysema) • fins, skin and eyes
Environmental Impact • As dissolved oxygen levels in water drop below 5.0 mg/l, aquatic life is put under stress. • The lower the concentration, the greater the stress. • Oxygen levels that remain below 1-2 mg/l for a few hours can result in large fish kills.
Cultural Eutrophication Is Too Much of a Good Thing • Cultural eutrophication – increase in nitrates and phosphate containing effluents from various sources in urban and agricultural communities
Eutrophication • Nutrients are food for algae, and water with high amounts of nutrients can produce algae in large quantities. • When these algae die, bacteria decompose them, and use up oxygen. • DO concentrations can drop too low for fish to breathe, leading to fish kills.
Organic Wastes • Remains of any living or once-living organism • Leaves, grass clippings, dead plants or animals, animal droppings, and sewage • Decomposed by bacteria; these bacteria remove dissolved oxygen from the water when they breathe.
Some Lakes Have More Nutrients Than Others • Oligotrophic lakes • Low levels of nutrients and low NPP • Eutrophic lakes • High levels of nutrients and high NPP • Mesotrophic lakes • Cultural eutrophication leads to hypereutrophic lakes
Water Stands in Some Freshwater Systems and Flows in Others • Standing (lentic) bodies of freshwater • Lakes • Ponds • Inland wetlands • Flowing (lotic) systems of freshwater • Streams • Rivers
Water Stands in Some Freshwater Systems and Flows in Others • Formation of lakes • Four zones based on depth and distance from shore • Littoral zone – top layer near the shore • Limnetic zone – open sunlit layer away from the shore; extends to depth penetrated by light • Profundal zone – deep open water; too dark for photosynthesis • Benthic zone – bottom of lake; mostly decomposers, detritus feeders and some fish
Stratification by temperature • Epilimnion • Hypolimnion
Lake Rain and snow Glacier Rapids Waterfall Tributary Flood plain Oxbow lake Salt marsh Deposited sediment Delta Ocean Source Zone Transition Zone Water Sediment Floodplain Zone Stepped Art Fig. 8-17, p. 176
Water Resources Chapter 13
Earth’s water supply: 97.2% 2.15% 0.62% 0.02% 0.001% World ocean Frozen in glaciers and ice caps Groundwater and soil moisture Streams and lakes Water vapor in the atmosphere Hydrologic Cycle
Hydrologic Cycle • Water moves between the ocean, atmosphere, and land.
We Get Freshwater from Groundwater and Surface Water • Ground water: water that percolates downward through the Earth until it collects in an impenetrable layer of rock • Zone of saturation: depth where Earth is completely filled with water
We Get Freshwater from Groundwater and Surface Water • Water table: top of groundwater zone • Aquifers: underground caverns and porous layers of sand, gravel, or bedrock through which groundwater flows • Natural recharge • Lateral recharge
Natural Capital: Groundwater System: Unconfined and Confined Aquifer
Water Tables Fall When Groundwater Is Withdrawn Faster Than It Is Replenished • India, China, and the United States • Three largest grain producers • Overpumping aquifers for irrigation of crops • Rate of pumping exceeds natural recharge • Deeper wells increase pollution • India and China • Small farmers drilling tubewells • Effect on water table
Water Tables Fall When Groundwater Is Withdrawn Faster Than It Is Replenished • Saudi Arabia • As water-poor as it is oil-rich! • 70% of drinking water produced by removing salt from seawater • High evaporation rates • Large pools and fountains • Aquifer depletion and irrigation
Natural Capital Degradation: Irrigation in Saudi Arabia Using an Aquifer
Case Study: Aquifer Depletion in the United States • Ogallala aquifer: largest known aquifer • Runs from South Dakota to Texas • One-time deposit of liquid natural capital • Irrigates the Great Plains
Is Building More Dams the Answer? • Dam: structure built across a river to control the river’s water flow • Reservoir: artificial lake formed when a river is dammed • 800,000 worldwide
Advantages • Increase the reliable runoff available by 1/3 • Reduce flooding • Grow crops in arid regions • Hydroelectricity
Disadvantages • Displaced 40-80 million people from their homes • Flooded agriculturally profitable regions the size of CA • Impaired ecological services of rivers • 1/5 loss of plant and animal species • High evaporation and seepage rates • Fill up with sediment within 50 years • 85% of US reservoirs by 2020
Case Study: The Colorado River Basin— An Overtapped Resource • Four Major problems • Colorado River basin has very dry lands • Modest flow of water for its size • Legal pacts allocated more water for human use than it can supply • Amount of water flowing to the mouth of the river has dropped
Using Laws to Protect Drinking Water Quality • 1974: U.S. Safe Drinking Water Act • Sets maximum contaminant levels for any pollutants that affect human health • 5.6 million Americans drink water that does not meet EPA safety standards • Health scientists: call for strengthening the law • Banning all toxic lead in new plumbing • Current laws allow fixtures with up to 10% lead to be sold as “lead free”