Download
1 / 23
230 likes | 315 Views
Wideband Simulation Results. AGCFG #3 & ACP WG-C#11 Lommaert Luc DAS/CSM 18-19 September, Brussels. European Organisation for the Safety of Air Navigation. Overview. Cellular Coms Capacity estimation for aviation Scenario definition for modelling CDMA2000 & UMTS

E N D
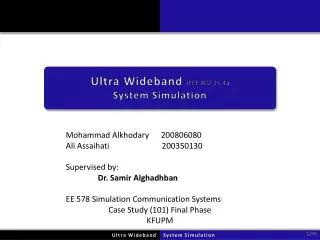
Wideband Simulation Results AGCFG #3 & ACP WG-C#11 Lommaert Luc DAS/CSM 18-19 September, Brussels European Organisation for the Safety of Air Navigation
Overview • Cellular Coms Capacity estimation for aviation • Scenario definition for modelling CDMA2000 & UMTS • Agilent - Wideband Simulations GENERIC SIMULATOR • Roke Manor / Siemens - Wideband Simulations SAAM DATA • Conclusions
CELLULAR CAPACITY : FREQUENCY RE-USE TDMA POWER TIME FREQ. F1 CDMA POWER F1 F1 FREQ. F2 F1 F7 F3 F1 F4 F6 F5 CDMA CLUSTER SIZE=1 GSM CLUSTER SIZE=7
Cellular Capacity - Interference Considerations AVIATION LEADS TO 3D SITUATIONINTERFERENCE Propagation losses make Signals decay with2nd order Due to Line of Sight adjacent cell INTERFERENCE will increase Saved by Radio Horizon Ioc Propagation losses make Signals decay with4th - 5th orderdue to Rayleigh Fading ( buildings-trees..) Isc 3th TIER 2nd TIER 1st TIER
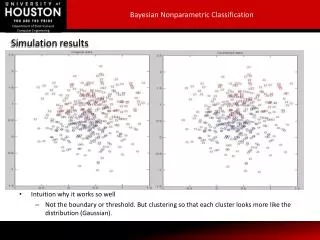
Verification of compatibility of modelling tools • Define a scenario for modelling • Implement the scenario on the Siemens and Agilent tool, generate results • Compare the results from the two modelling exercises and justify any disparities
Direct Comparison of Results • Agilent Model includes extra-cell interference • Conclusion drawn is that Roke and Agilent Methodologies are essentially the same and lead to comparable results At 2% Blocking, Mean No of Users Roke = 46.8, Agilent = 43.0
Agilent’s Generic Capacity Simulator Single cell , Infinite Power Standard ideal POLE capacity equations • Adapted for: • keep-alive channels • activity factor • orthogonality factor • other-cell interference Forward link capacity STATIC Reverse link capacity Bottleneck STATISTIC Users Random allocated Uniform distributed Erlang capacity calculation (through Monte Carlo simulation)
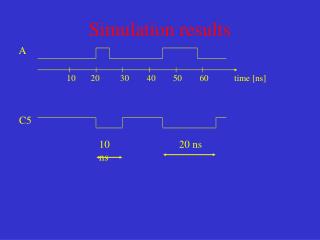
Simulation results Air interface specific parameters • Values based on: 3GPP2 C.S0010 (BS) and C.S0011 (MS) • 3GPP 25.104 (BS) and 25.101 (MS)
Simulation results :Ideal STATIC capacity • Note: • STATIC capacity : rough & optimistic estimation • The FL capacity is 3 to 4 times larger than the RL capacity • Larger cells see less interference from neighboring cells → more users
Final Simulation results Reverse link Erlang capacity Cell size impact Eb/No = 6 dB CPICH/TCH=-3,75dB
Simulation results Reverse link Erlang capacity Antenna diversity impact
CDMA2000 9.6 kbps with RMR optimized system parameters (Eb/No, R-PICH/TCH ) Reverse link Erlang capacity
Simulation Methodology COCR Analysis Traffic Scenario Definition Simulation SAAM Data Analysis of Deployment Simulations Processing Results Definition Radio System Parameter Derivation
cdma2000 Simulation Parameters • cdma2000 Release C • Radio Configuration 1, Spreading Rate 1 (1.2288 Mcps) • Four Quasi-Orthogonal Codes with equal BS Power • Max BS Tx Power = 43 dBm, Pilot Power 20%. Max 20% Power/user • Max Aircraft Tx Power = 33 dBm • Assumptions: Two Antenna Base Station Diversity, 0.2% FER, 1dB Implementation Loss
Simulations Results + Future work • COCR 9,6 kbps 10% activity • Reverse Link Limited (as expected) • Switzerland scenario presents the ‘greatest challenge’ • Higher number of aircraft • Second cdma2000 carrier was required in this scenario • Total Bandwidth Required 2025 • cdma2000 – 2 (carriers) x 2 (duplex) x 1.25 MHz = 5 MHz • UMTS – 1 (carrier) x 2 (duplex) x 5 MHz = 10 MHz • ALL SIMULATIONS DONE ON GREEN FIELD SPECTRUM • L-band Interference study :methodology M.1639/1477
CONCLUSIONS • Large capacity improvements • Eb/No target • Keep-alive channel power fraction • Sectorisation • Both standards forsee in system parameters adaptation • Support of all QoS (Conv, Stream, Interactive, Background) • Support of multiple coders/decoders (Viterbi, Turbo) • Support of multiple frame sizes ( 10,20,40,80ms) • Use Packetdata channel i.s.o dedicated traffic channels • COCR requirements met with FDD 2 x 5 MHz UMTS or 2 x 1,25MHz CDMA2000