Download
1 / 1
80 likes | 239 Views
GSA CORDILLERAN SECTION and PACIFIC SECTION AAPG with WESTERN REGIONAL SPE 27-29 May 2010, Anaheim, California The January 10, 2005 La Conchita Landslide. Philip J. Shaller 1 , Parmeshwar L. Shrestha 1 , Macan Doroudian 1 , Douglas L. Hamilton 1 , and David W. Sykora 2

E N D
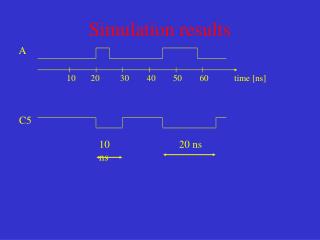
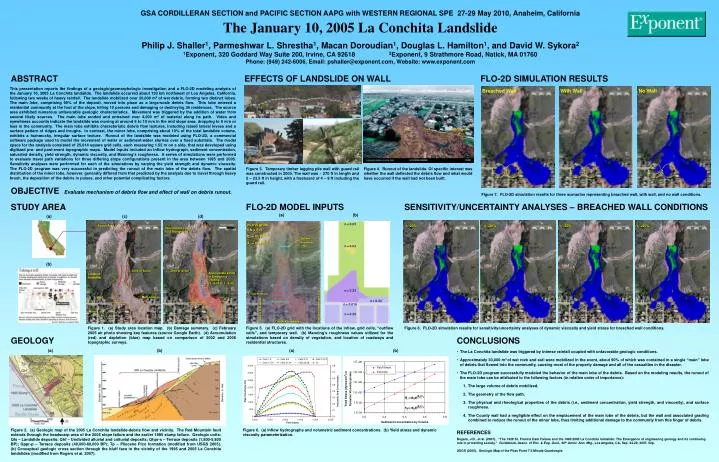
GSA CORDILLERAN SECTION and PACIFIC SECTION AAPG with WESTERN REGIONAL SPE 27-29 May 2010, Anaheim, California The January 10, 2005 La Conchita Landslide Philip J. Shaller1, Parmeshwar L. Shrestha1, Macan Doroudian1, Douglas L. Hamilton1, and David W. Sykora2 1Exponent, 320 Goddard Way Suite 200, Irvine, CA 92618 2Exponent, 9 Strathmore Road, Natick, MA 01760 Phone: (949) 242-6006, Email: pshaller@exponent.com, Website: www.exponent.com ABSTRACT EFFECTS OF LANDSLIDE ON WALL FLO-2D SIMULATION RESULTS This presentation reports the findings of a geologic/geomorphologic investigation and a FLO-2D modeling analysis of the January 10, 2005 La Conchita landslide. The landslide occurred about 130 km northwest of Los Angeles, California, following two weeks of heavy rainfall. The landslide mobilized over 30,000 m3 of wet debris, forming two distinct lobes. The main lobe, comprising 90% of the deposit, moved into place as a large-scale debris flow. This lobe entered a residential community at the foot of the slope, killing 10 persons and damaging or destroying 36 residences. The source area exhibited numerous unfavorable geologic characteristics. Movement was triggered by the addition of water from several likely sources. The main lobe eroded and entrained over 4,000 m3 of material along its path. Video and eyewitness accounts indicate the landslide was moving at around 6 to 10 m/s in the mid slope area, dropping to 5 m/s or less in the community. The main lobe exhibits characteristic debris flow textures, including raised lateral levees and a surface pattern of ridges and troughs. In contrast, the minor lobe, comprising about 10% of the total landslide volume, exhibits a hummocky, irregular surface texture. Runout of the landslide was modeled using FLO-2D, a commercial software package used to model the movement of water or sediment-water slurries over a fixed substrate. The model space for the analysis consisted of 25,614 square grid cells, each measuring 1.52 m on a side, that was developed using digitized pre- and post-event topographic maps. Model inputs included an inflow hydrograph, sediment concentration, saturated density, yield strength, dynamic viscosity, and Manning’s roughness. A series of simulations were performed to evaluate travel path variations for three differing slope configurations present in the area between 1995 and 2005. Sensitivity analyses were performed for each of the simulations by varying the yield strength and dynamic viscosity. The FLO-2D program was very successful in predicting the runout of the main lobe of the debris flow. The spatial distribution of the minor lobe, however, generally differed from that predicted by the analysis due to travel through heavy brush, the deposition of the debris in pulses, and other potential complicating factors. Breached Wall With Wall No Wall Figure 3. Temporary timber lagging pile wall with guard rail was constructed in 2000. The wall was ~ 270 ft in length and 5 – 23.5 ft in height, with a freeboard of 4 – 9 ft including the guard rail. Figure 4. Runout of the landslide. Of specific interest was whether the wall deflected the debris flow and what would have occurred if the wall had not been built. OBJECTIVE Evaluate mechanism of debris flow and effect of wall on debris runout. Figure 7. FLO-2D simulation results for three scenarios representing breached wall, with wall, and no wall conditions. STUDY AREA FLO-2D MODEL INPUTS SENSITIVITY/UNCERTAINTY ANALYSES – BREACHED WALL CONDITIONS (a) (b) (a) (c) (d) h -20% h +20% ty -20% ty +20% Source Area Approximate Limits of 2002 Topography (b) Zone of Scour Zone of Scour Approximate Limits of Emergency Grading (1-10-05 to 1-14-05) Main Lobe Minor Lobe Figure 1. (a) Study area location map. (b) Damage summary. (c) February 2005 air photo showing key features (source Google Earth). (d) Accumulation (red) and depletion (blue) map based on comparison of 2002 and 2006 topographic surveys. Figure 5. (a) FLO-2D grid with the locations of the inflow, grid cells, “outflow cells”, and temporary wall. (b) Manning’s roughness values utilized for the simulations based on density of vegetation, and location of roadways and residential structures. Figure 8. FLO-2D simulation results for sensitivity/uncertainty analyses of dynamic viscosity and yield stress for breached wall conditions. GEOLOGY CONCLUSIONS (a) (b) (a) (b) • The La Conchita landslide was triggered by intense rainfall coupled with unfavorable geologic conditions. • Approximately 30,000 m3 of wet rock and soil were mobilized in the event, about 90% of which was contained in a single “main” lobe of debris that flowed into the community, causing most of the property damage and all of the casualties in the disaster. • The FLO-2D program successfully modeled the behavior of the main lobe of the debris. Based on the modeling results, the runout of the main lobe can be attributed to the following factors (in relative order of importance): • 1. The large volume of debris mobilized. • 2. The geometry of the flow path. • 3. The physical and rheological properties of the debris (i.e., sediment concentration, yield strength, and viscosity), and surface roughness. • 4. The County wall had a negligible effect on the emplacement of the main lobe of the debris, but the wall and associated grading combined to reduce the runout of the minor lobe, thus limiting additional damage to the community from this finger of debris. Figure 2. (a) Geologic map of the 2005 La Conchita landslide-debris flow and vicinity. The Red Mountain fault extends through the headscarp area of the 2005 slope failure and the earlier 1995 slump failure. Geologic units: Qls – Landslide deposits; Qhf – Undivided alluvial and colluvial deposits; Qhpr-s – Terrace deposits (1,800-5,800 BP); Qppr-p – Terrace deposits (40,000-60,000 BP); Tp – Pliocene Pico formation (modified from USGS 2005). (b) Conceptual geologic cross section through the bluff face in the vicinity of the 1995 and 2005 La Conchita landslides (modified from Rogers et al. 2007). Figure 6. (a) Inflow hydrographs and volumetric sediment concentrations. (b) Yield stress and dynamic viscosity parameterization. REFERENCES Rogers, J.D., et al. (2007). “The 1928 St. Francis Dam Failure and the 1995/2005 La Conchita landslide: The Emergence of engineering geology and its continuing role in protecting society.” Guidebook, Assoc. of Env. & Eng. Geol., 50th Anniv. Ann. Mtg., Los Angeles, CA, Sep. 24-29, 2007, 52p. USGS (2005). Geologic Map of the Pitas Point 7.5-Minute Quadrangle.