Download
1 / 13
130 likes | 354 Views
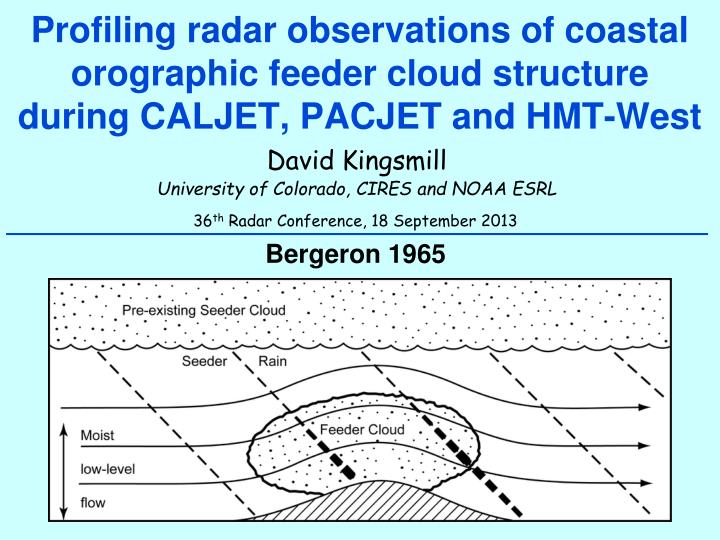
Profiling radar observations of coastal orographic feeder cloud structure during CALJET, PACJET and HMT-West. David Kingsmill University of Colorado, CIRES and NOAA ESRL. 36 th Radar Conference, 18 September 2013. Bergeron 1965. Doppler Radar. Aircraft. CALJET, PACJET and HMT-West:

E N D
Profiling radar observations of coastal orographic feeder cloud structure during CALJET, PACJET and HMT-West David Kingsmill University of Colorado, CIRES and NOAA ESRL 36th Radar Conference, 18 September 2013 Bergeron 1965 Doppler Radar Aircraft
CALJET, PACJET and HMT-West: Improve understanding and prediction of land-falling Pacific winter storms SPROF data at CZC NOAA ESRL S-band precipitation profiler (SPROF) at Cazadero (CZC)
Rainfall Process Partitioning at Cazadero for Jan-Mar 1998 White et al. (2003), MWR
12-Season Composite Rain Type Statistics Excludes Convective Rain Number of Profiles Accumulated Rain 4.3 mm/hr 3.3 mm/hr BB NBB BB NBB BBHT ≥2.1 km 5.3 mm/hr 3.2 mm/hr BB NBB BB NBB
Histograms of Reflectivity Slope FGG to 1.7 km BB+NBB Rain BB Rain NBB Rain
Scatter Plots of FGG dBZ vs dBZ Slope FGG to 1.7 km BB+NBB Rain BB Rain NBB Rain
Histograms of Rainwater Content Slope FGG to 1.7 km BB+NBB Rain BB Rain NBB Rain
Scatter Plots of FGG RWC vs RWC Slope FGG to 1.7 km BB+NBB Rain BB Rain NBB Rain
Summary Episode 2 had larger cross-barrier bulk IWV flux and precipitation rates compared to Episode 1 The AR rode up and over the SBJ during both episodes, but there were structural differences: Episode 1 SBJ southeasterly at ~25-30 m/s, ~0.2-1.5 km MSL SBJ-AR interface extended to west edge of Central Valley and sloped SW-NE at 1-2 % Episode 2 SBJ southerly at ~20-25 m/s, ~0.3-2.5 km MSL SBJ-AR interface extended to west half of Central Valley and sloped SW-NE at 2-4 %