Download

1 / 40
400 likes | 513 Views
GEBA Project Summary. Dongying Wu. Phylogenetic Tree Building (Martin Wu). Concatenate alignments of 31 marker genes build a PHYML tree 667 non-GEBA genomes, 53 genomes. Phylogenetic Distance (PD). B. b. C. c. d. a. A. PD=sum of all the branch lengths PD{A,B,C}=a+b+c+d.

E N D
GEBA Project Summary Dongying Wu
Phylogenetic Tree Building (Martin Wu) Concatenate alignments of 31 marker genes build a PHYML tree 667 non-GEBA genomes, 53 genomes
Phylogenetic Distance (PD) B b C c d a A PD=sum of all the branch lengths PD{A,B,C}=a+b+c+d
Phylogenetic Distance Contribution of GEBA genomes The total tree PD is 88.8, GEBA add 11.0 to the tree. 53 random non-GEBA taxa (from a pool of 667) contribute 3.15 to the tree PD (standard deviation:0.68 for 100 sampling) The 26 GEBA actinobacteria add 4.29 to the total PD (actinobacteria as a whole add 8.128 PD) 26 random non-GEBA actinobacteria (from a pool of 47) contribute 1.37 PD (standard deviation 0.28, 100 sampling)
Gene Family Classification Blastp: E value cutoff 1e-10, report 10000 hits Only blastp hits that span 80% of the lengths of both genes are kept as links 227,562 genes from 56 genomes => 17,176,180 links
MCL Clustering Algorithm Links (matrix of sequence identities) Expansion Inflation (I=2) equilibrium state
1 50 - 100 3 20 - 50 10 - 20 6 ( g 5 - 10 27 e F n a e m s 511 i / 1 - 5 l g y e S n 1305 20/56 - 1 i o z e m 1588 e 10/56 - 20/56 ) 2755 5/56 - 10/56 10601 2/56 - 5/56 46689 1/56 0 10000 20000 30000 40000 50000 Number of Families
Evenness estimation genome Gene distribution ratio for family X 0.132 A 0.316 B 0.105 0.079 C 0.026 0.158 D 0 0.184 Median 0.184 0 E 0.184 0.031 F 0.215 0.031 G 0.158 dist: Distanceaverrage=0.087 -4 x dist Evenness= 100 x e
Universality: ratio of genomes that a family appears in Evenness: even distribution of gene family members across genomes Size: number of members in a gene family
Large families: famID size functions F2669 4210 (75/genome) ABC-type transport system ATP-binding proteinF2670 1542 (27/genome) multi-sensor hybrid histidine kinase F2671 1367 (24/genome) short chain dehydrogenaseF2672 1157 (20/genome) acyl-CoA synthetaseF2673 782 (14/genome) serine/threonine protein kinaseF2674 755 (13/genome) two-component system response regulator (LuxR family)F2675 735 (13/genome) two-component system response regulator (winged helix family) F2676 614 (11/genome) drug resistance transporterF2677 606 (11/genome) transcriptional regulator, LacI familyF2678 568 (10/genome) two-component system sensor sensor histidine kinaseF2679 543 (10/genome) sugar ABC transporter, permease component
Low universality large families: famID size organism family function taxonomy number F2682 461 7 outer membrane protein Bacteroidetes; Proteobacteria F2699 303 6 outer membrane protein Bacteroidetes F2736 180 6 anti-sigma factor Bacteroidetes; Proteobacteria F2760 153 6 transcriptional regulator, AraC family Bacteroidetes; proteobacteria F2772 147 5 RNA polymerase ECF-type sigma factor Bacteroidetes (Sphingobacteriales) F2801 129 11 DNA-binding protein Actinobacteria(Actinobacteridae) F2827 114 3 FtsX transmembrane transport protein Bacteroidetes (Sphingobacteriales) F2867 103 3 hypothetical protein Actinobacteria;(Coriobacteriaceae)
3 out of 9 largest families have very low evenness value ( < 5) two-component system response regulator (LuxR) short chain dehydrogenase acyl-CoA synthetase 0 0 60 6 6 50 0 50 5 0 0 0 4 4 4 0 0 0 3 3 3 0 0 0 2 2 2 0 0 0 1 1 1 0 0 0 0 0 0 0 0 0 0 0 0 0 0 0 0 0 0 0 0 0 0 0 0 0 0 0 0 0 0 7 6 5 4 3 2 1 8 0 9 6 4 3 2 1 8 7 5 4 2 2 8 0 6 1 1 1
phylum specific family 26/56 Actinobacteria
712 families (size >=10) are phylum specific 350 300 42 670 250 200 Family size 150 100 50 0 0 5 10 15 20 25 Organism number
The largest 6 phylum-specific families F2699 Bacteroidetes=303; outer membrane protein *F2752 Actinobacteria=160; RNA polymerase, sigma-24 subunit, ECF family F2772 Bacteroidetes=147; putative ECF-type RNA polymerase sigma factor F2801 Actinobacteria=129; DNA-binding protein F2827 Bacteroidetes=114; FtsX-related transmembrane transport protein F2867 Actinobacteria=103; unknown functions * From 15 organisms
Novel gene families: None of the genes in a family has a Genbank hit (e cutoff: 1e-5)
Streptococcus agalactiae “pan-genome” Tettelin H. et.al. PNAS 2005;102:13950-13955
217,079 genes from 53 GEBA Bacterial genomes 60024 families N genomes Number of families with the selected genomes A: N from1 to 53 B: For every N, sample the families 100 times
70000 from GEBA project Bacteria 60000 50000 40000 3000 Gene Family Number (including families with single members) 2500 30000 2000 New Genome families 1500 20000 1000 500 10000 0 0 10 20 30 40 50 60 Number of Genomes 0 0 10 20 30 40 50 60 70 80 Genome Number
Streptococcus agalactiae(8 strains) Enterobacteriaceae: (40 genomes) • Escherichia coli • Yersinia pestis • Salmonella enterica • 3 Shigella flexneri Actinobacteria: (73 genomes, including 26 GEBA genomes) Bacteria: (53 GEBA genomes)
70000 60000 Actinobacteria 50000 40000 30000 20000 Enterobacteriaceae 10000 S. agalactiae 0 0 10 20 30 40 50 60 70 80 from GEBA project Bacteria Gene Family Number (including families with single members) Genome Number
350000 300000 250000 200000 150000 100000 S. agalactiae Enterobacteriaceae 50000 Actinobacteria Bacteria from GEBA project 0 0 10 20 30 40 50 60 70 80 Total Gene Number Genome Number
70000 60000 50000 40000 30000 20000 10000 0 0 50000 100000 150000 200000 250000 300000 350000 Gene Family Number S. agalactiae Enterobacteriaceae Actinobacteria Bacteria from GEBA project Total Gene Number
Calculate the PD (Phylogenetic Diversity) Of a sub-tree
18 16 14 12 10 8 Actinobacteria 6 4 2 Enterobacteriaceae 0 0 10 20 30 40 50 60 70 80 Bacteria from GEBA project Phylogenetic Diversity Genome Number
70000 60000 50000 40000 30000 20000 Actinobacteria Enterobacteriaceae 10000 0 0 2 4 6 8 10 12 14 16 18 Gene Family Number from GEBA project Bacteria Phylogenetic Diversity
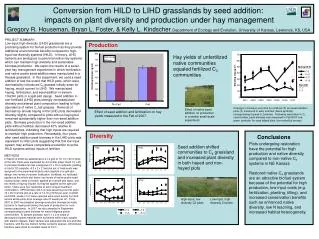
How far down the road GEBA has to go in terms of PD coverage 232812 Bacterial/Archaeal ss-rRNA from Greengenes MCL 99% Identity at 80% span 45997 clusters Filter out ss-rRNA from Genome Porjects 99% identity cutoffs Filter out 18751 low-quality sequences short sequences <=1200nt low-quality sequences duplicates chimerics 667 Combo Bacterial ss-rRNA 50 Combo Archaeal ss-rRNA 56 GEBA ss-rRNA 42426 Greengenes Bacterial/Archaeal ss-rRNA Retrieve alignments from greengenes Trim by the greengenes mask QuickTree Distant Tree for all representatives
74437 non-environmental Bacterial/Archaeal ss-rRNA from Greengenes MCL 99% Identity at 80% span 10397 clusters Filter out ss-rRNA from Genome Porjects 99% identity cutoffs Filter out low-quality sequences short sequences <=1200nt low-quality sequences duplicates chimerics 667 Combo Bacterial ss-rRNA 50 Combo Archaeal ss-rRNA 56 GEBA ss-rRNA 9946 Greengenes Bacterial/Archaeal ss-rRNA Retrieve alignments from greengenes Trim by the greengenes mask QuickTree Distant Tree for non-environmental representatives
Pre-GEBA *start from Haemophilus influenzae Rd KW20 **In each group, the taxa are sorted by their PD contributions in descending order GEBA Greengenes
1200 GEBA genomes pre-GEBA genomes 1000 Organisms from the greengenes database Organisms from the greengenes database (excluding environmental samples) 800 100 80 600 Phylogenetic Diversity 60 400 40 20 200 0 0 400 800 1200 0 0 5000 10000 15000 20000 25000 30000 35000 40000 Organism Numbers
The slopes of the linear regression Lines represent the PD contribution of the genomes (each window contains 50 genomes)
Non-environmental Tree Only the top 150 PD contributors out of 717 pre-GEBA genomes have an average PD contribution greater than the GEBA genomes. The genome sequencing efforts have only covered 11.5% phylogenetic diversity to date in this study. We can pick an additional 550 organisms and still have an average PD contribution greater than or equal to the 56 GEBA genomes To increase PD coverage to 50%, we need to sequence at least 1520 more genomes
All-representative Tree Current genome sequences only cover 2.2% of the PD We can pick an additional 4400 organisms and still have an average PD contribution greater than or equal to the 56 GEBA genomes To cover 50% of the phylogenetic diversity, we have to sequences 9218 more genomes
rbcL Active sites Catalytic RuBP binding
Calvin cycle CO 2 Ribulose-5-P rpe Ribulose-1,5-P rbcL Xylulose-P Glycerate-3-P tktA glpX gap pgk tpiA Fructose-6-P P-glyceroyl-P GAP DHAP Fructose-1,6-P
Calvin Cycle * Finished genome