Download
1 / 1
40 likes | 234 Views
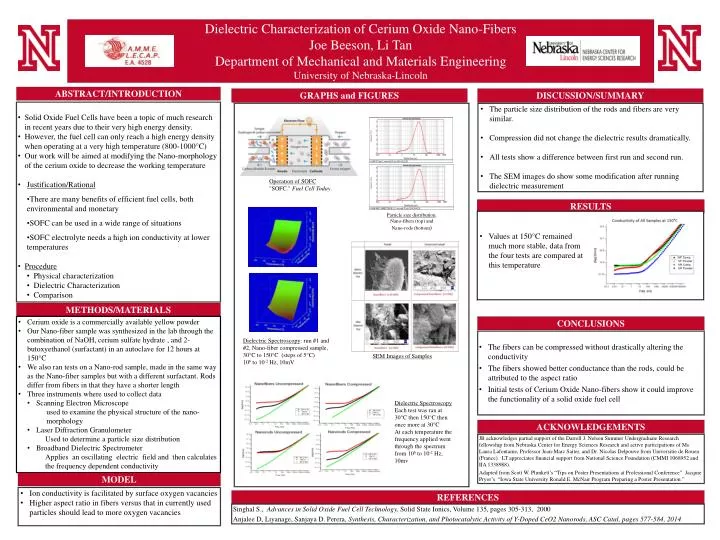
Dielectric Characterization of Cerium Oxide Nano-Fibers Joe Beeson , Li Tan Department of Mechanical and Materials Engineering University of Nebraska-Lincoln. ABSTRACT/INTRODUCTION. DISCUSSION/SUMMARY. GRAPHS and FIGURES.

E N D
Dielectric Characterization of Cerium Oxide Nano-Fibers Joe Beeson, Li Tan Department of Mechanical and Materials Engineering University of Nebraska-Lincoln ABSTRACT/INTRODUCTION DISCUSSION/SUMMARY GRAPHS and FIGURES • Solid Oxide Fuel Cells have been a topic of much research in recent years due to theirvery high energy density. • However, the fuel cell can only reach a high energy density when operating at a very high temperature (800-1000°C) • Our work will be aimed at modifying the Nano-morphology of the cerium oxide to decrease the working temperature • Justification/Rational • There are many benefits of efficient fuel cells, both environmental and monetary • SOFC can be used in a wide range of situations • SOFC electrolyte needs a high ion conductivity at lower temperatures • Procedure • Physical characterization • Dielectric Characterization • Comparison • The particle size distribution of the rods and fibers are very similar. • Compression did not change the dielectric results dramatically. • All tests show a difference between first run and second run. • The SEM images do show some modification after running dielectric measurement Operation of SOFC "SOFC." Fuel Cell Today. RESULTS Particle size distribution. Nano-fibers (top) and Nano-rods (bottom) • Values at 150°C remained much more stable, data from the four tests are compared at this temperature METHODS/MATERIALS • Cerium oxide is a commercially available yellow powder • Our Nano-fiber sample was synthesized in the lab through the combination of NaOH, cerium sulfate hydrate , and 2-butoxyethanol (surfactant) in an autoclave for 12 hours at 150°C • We also ran tests on a Nano-rod sample, made in the same way as the Nano-fiber samples but with a different surfactant. Rods differ from fibers in that they have a shorter length • Three instruments where used to collect data • Scanning Electron Microscope • used to examine the physical structure of the nano- morphology • Laser Diffraction Granulometer • Used to determine a particle size distribution • Broadband Dielectric Spectrometer • Applies an oscillating electric field and then calculates the frequency dependent conductivity CONCLUSIONS • The fibers can be compressed without drastically altering the conductivity • The fibers showed better conductance than the rods, could be attributed to the aspect ratio • Initial tests of Cerium Oxide Nano-fibers show it could improve the functionality of a solid oxide fuel cell Dielectric Spectroscopy: run #1 and #2, Nano-fiber compressed sample, 30°C to 150°C (steps of 5°C) 106 to 10-2 Hz, 10mV SEM Images of Samples Dielectric Spectroscopy Each test was ran at 30°C then 150°C then once more at 30°C At each temperature the frequency applied went through the spectrum from 106 to 10-2Hz, 10mv ACKNOWLEDGEMENTS JB acknowledges partial support of the Darrell J. Nelson Summer Undergraduate Research fellowship from Nebraska Center for Energy Sciences Research and active participations of Ms. Laura Lafontaine, Professor Jean-Marc Saiter, and Dr. Nicolas Delpouve from Universitie de Rouen (France). LT appreciates financial support from National Science Foundation (CMMI 1068952 and IIA 1338988). Adapted from Scott W. Plunkett’s “Tips on Poster Presentations at Professional Conference” Jacquie Pryor’s “Iowa State University Ronald E. McNair Program Preparing a Poster Presentation.” MODEL • Ion conductivity is facilitated by surface oxygen vacancies • Higher aspect ratio in fibers versus that in currently used particles should lead to more oxygen vacancies REFERENCES Singhal S., Advances in Solid Oxide Fuel Cell Technology, Solid State Ionics, Volume 135, pages 305-313, 2000 Anjalee D, Liyanage, Sanjaya D. Perera, Synthesis, Characterization, and Photocatalytic Activity of Y-Doped CeO2 Nanorods, ASC Catal, pages 577-584, 2014