Download
1 / 56
560 likes | 696 Views
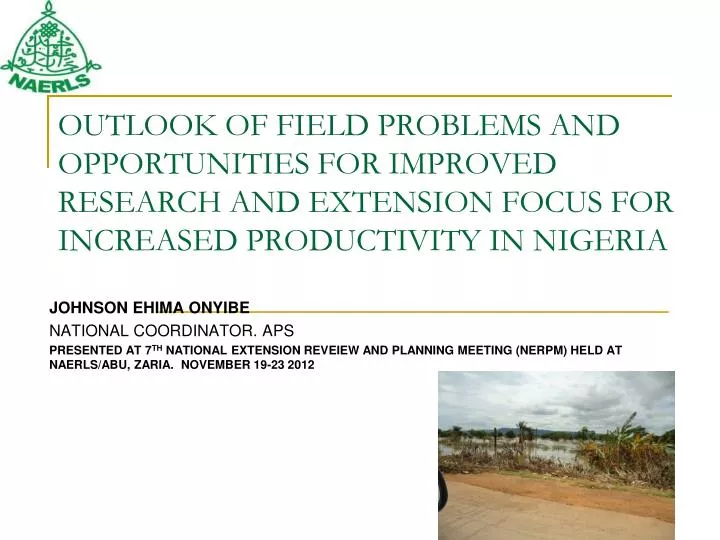
OUTLOOK OF FIELD PROBLEMS AND OPPORTUNITIES FOR IMPROVED RESEARCH AND EXTENSION FOCUS FOR INCREASED PRODUCTIVITY IN NIGERIA. JOHNSON EHIMA ONYIBE NATIONAL COORDINATOR. APS PRESENTED AT 7 TH NATIONAL EXTENSION REVEIEW AND PLANNING MEETING (NERPM) HELD AT NAERLS/ABU, ZARIA. NOVEMBER 19-23 2012.

E N D
OUTLOOK OF FIELD PROBLEMS AND OPPORTUNITIES FOR IMPROVED RESEARCH AND EXTENSION FOCUS FOR INCREASED PRODUCTIVITY IN NIGERIA JOHNSON EHIMA ONYIBE NATIONAL COORDINATOR. APS PRESENTED AT 7TH NATIONAL EXTENSION REVEIEW AND PLANNING MEETING (NERPM) HELD AT NAERLS/ABU, ZARIA. NOVEMBER 19-23 2012
November 28 2011 FAO World report • Worldwide, the poorest have the least access to land and water and are locked in a poverty trap of small farms with poor quality soils and high vulnerability to land degradation and climatic uncertainty,”
I just rechecked my source, the FAOSTAT (2009-11) and this is exactly what you would see there. I have attached herewith the data I downloaded on 09 July 2012. Your observation actually raises a bigger question: FAO data are inconsistent in many cases. That is why I have always insisted (both at DTMA and in my previous roles) that we rely on national data. I am still pushing this idea. …… Dr Tsedeke Abate Project Coordinator, Gates Foundation Supported DTMA Project
Objectives (APS) • Constrained to increased productivity identified • Agricultural production situation and factors affecting extension service documented • Feedbacks for improved research-extension and policy performance provided
Trend of APS • Conducted for over 18 years • Partners involve continue to increase over time • Presented in three forms • Executive Summary • State Reports • National Report • The reports are useful planning tools (policy makers, development workers, private sector agencies) • Continuous improvement of the quality of report to eliminate discrepancies has been sustained
Methodology • Consultation with stakeholders • Structured questionnaires • ADPs/MANR • Farmers • Field survey • Dialogues with ADPs/ States MANR • On-farm report preparation • 10-days Stratified sampling • Farmers interviews at 148 sites • Wrap-up/validation with ADPs/MANR • MTRM/QTR/ Zonal meeting/ In-house reviews in previous • Report from NIMET/ Zones Officers/field offices
Non NARIs Partners NARIs Institute for Agricultural Research (IAR) Institute of Agriculture and Training (IAR&T) Lake Chad Research Institute (LCRI) National Root Crop Research Institute (NRCRI) National Cereals Research Institute (NCRI) National Institute of Meteorological Agency (NIMET) National Productivity Centre (NPC) National Programme on Agriculture and Food Security (NPAFS) National Bureau of Statistics (NBS) Planning Policy Appraisal and Statistics Dept Federal Dept of Fertilizers Federal Dept of Agric Extension Federal Dept of Agric Federal Dept of Livestock Federal Dept of Fisheries FAO/USDA future involvement envisaged
From Other Agencies Resources used From ADPS Farmers listing Village listing Selection of sites for field visit Completion of questionnaires templates Identification of farmer groups MTRM field situation reports Facilitators/Enumerators/ Some logistics NBS (import data (trade summaries)/ Resource persons) Report from ADPs and Logistics, Funding support
Trend • Some states however recorded reduction in aquaculture outputs in 2012. • The trend in aquaculture output show reduction of -3.64% in Niger, -19.51 % in Gombe and -10.1% in Jigawa States respectively
Flooding rain storms Field Problems- Rainfall Floods and some dry spells
Weather • Heavy rains beyond expectations that resulted in floods occurred this year in more than 20 states
Eroding Natural Resource Base • Land • Erosion (SE & SW Zones) • Declining soil fertility (NW, CZ & NE Zones) • Deforestation • Fuel wood energy challenge due high kerosene price • Low response to tree planting campaign • Desertification • Disappearing peri-urban farmlands • Encroachment of grazing reserves • Dis-appearing in-land waters • Growing menace of troublesome weeds • Droughts and Floods
Input problems • High cost of credits and cumbersome procedure • Delay in input supply (ATA) • Increased incidence of fake seeds discouraging adoption of improved seeds • High cost of fertilizer and delays in supply • Inadequate tractor operators and maintenance technicians • High incidence of pesticides failures (lack of technical skill to use) • Pesticide abuse due to lack of usage skill • High cost of diesel for tractors/farm operations • Scarcity of labour • Disappearing peri-urban farm lands • High cost of transportaion • High cost of vet drugs and feeds especially fish feeds
Field problems-crop • Low yields • Pests and diseases • Agro-pastoralist conflicts • High post harvest losses • Inadequate irrigation facilities and problem of repairs of irrigation pumps/tube wells • High cost of land preparation and • Election/civil crisis • Low producers price except for Soybean and cowpea which was favourable • Politics taking up labour and attention • Cost of production doubled in many instances
Irrigation facilities are breaking down, Example from Kura, Kano State
Problem of extension service (ADPs) • Poor funding • Low EA: farmer ratios • Politicization of leadership of extension service agencies • Parallel Extension outfits emerging and duplicating efforts/diversion of resources • Mobility problem • Poor staffing and non-replacement of retired staff
ADP Funding and Staffing Adequacy • average age of extension agents in most of the ADPS ranged from 45 to 55 years. In many states, up to 35 % of the existing staff will retire over the next 4 years and more than 74 % will retire within the next 10 years
FNTs/MTs and MTRMs/QTRMs • Forth Nightly Training (FNT) of farmers was not conducted by 41% of the ADPs due to financial and other logistics problems. • Anambra, Ekiti , Benue, Kogi and Benue states conducted a few FNTs in 2012. • 65% of the ADPs conducted MTRM
Situation • About 65% of the state ADPs did not conduct SPAT. • Also about 54% of them did not establish MTPs due to inadequate and untimely release of fund by government
What ATA Achieved-1 • Under ATA improved seeds and fertilizer were distributed to farmers in 26 states of the federation and the FCT through the Growth Enhancement Support Scheme and e-wallet ICT application concept.
What ATA Achieved-2 • 11- 19 % increase of area and outputs of most of the commodities of target under ATA in 2012 over figures of 2011
What ATA Achieved-3 • Eliminated anomalous schemes in which subsidies on production inputs such as fertilizer and improved seeds are creamed off before they get to the farmers.
Number of Village Extension Agents (VEAs • EA: Farm family ratio in Bayelsa- 1:10,568 • Anambra-1:9409 • Cross Rivers-1:4721 • Benue States-1:4000 respectively.
Impact of the Flood • 22.4 % depression on rice output, • 14.6% depression on maize output; • 11.2% decrease on soybean output; • 9.3% reduction in cassava output and • 6.3% reduction in cowpea output. • Losses of about 1.178 million tons of rice, • 1.416 million tons of maize, • 69,060 tons of soybean, • 4.87 million and 118,944 tons of cassava and cowpea outputs respectively
Recommendations- • 1 Serious investments in irrigation infrastructure and broad-based skill improvement to optimize the use irrigation • 2. Ensuring effective after sales services for tractors, comprehensive inventory of tractors and other farm machines, and skill development for tractor repairs are desirable to keep existing tractors functional while acquiring new ones. • 3. Improved funding should be provided for research to mitigating the effects of climate change- and to increase productivity • 4. Problem of staffing and funding in ADPs require Innovative federal intervention to avert total collapse of the agriculture extension service in the country.
Recommendation • Conduct of a national census of extension personnel and unemployed graduates with a view to factoring their integration into agricultural value chain incubation schemes upon which the transformation agenda would be leveraged.