Download
1 / 31
310 likes | 524 Views
Analysis of LIFE Study by Ethnic Demographic Subgroup. John Lawrence Mathematical Statistician FDA/CDER/Division of Biometrics I. I. General Issues in Analysis of Subgroups II. Other Relevant Studies III. LIFE study IV. Summary. Outline. I. General Issues in Analysis of Subgroups.

E N D
Analysis of LIFE Study by Ethnic Demographic Subgroup John Lawrence Mathematical Statistician FDA/CDER/Division of Biometrics I DCRDP Advisory Committee Meeting January 6, 2003
I. General Issues in Analysis of Subgroups II. Other Relevant Studies III. LIFE study IV. Summary Outline DCRDP Advisory Committee Meeting January 6, 2003
I. General Issues in Analysis of Subgroups • D=overall effect of drug relative to control-trial is designed to answer question about D • Effectiveness is not uniform across individuals or across subgroups-pharmacokinetic variability-genetic or environmental differences-differences in disease pathogenesissee Wood (2001) NEJM 344 (18):1393 DCRDP Advisory Committee Meeting January 6, 2003
Analysis of Subgroups • What does a successful clinical trial show?-as a group a large number of patients treated with the test drug would be better off-it does not show that every individual would be better off DCRDP Advisory Committee Meeting January 6, 2003
Analysis of Subgroups -Subgroups can be surrogate markers for genetic or other factors that effect individual responses to a drugsee Exner et al. (2001) NEJM 344(18):1351 DCRDP Advisory Committee Meeting January 6, 2003
Analysis of Subgroups • Confidence intervals for treatment effect in subgroups used to describe what was observed • Expect to see differences in point estimates • Generally, no tests of hypotheses for subgroups (small sample sizes => low power) • Analysis is usually post hoc- different ways of testing for interaction DCRDP Advisory Committee Meeting January 6, 2003
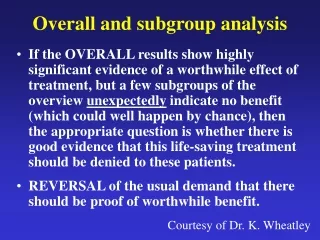
Analysis of Subgroups • Subgroup analysis intended to explore uniformity of overall effect • Usually informative only when there is a significant overall effect • High false positive or false negative rate see Peto R. et al (1977) Brit. J. of Cancer (35): 1-39 ICH Topic E9 “Statistical Principles for Clinical Trials”: 30 Fleming T. (1995) Drug Info. J. (29):1681S-1687S DCRDP Advisory Committee Meeting January 6, 2003
Quantitative vs. Qualitative Treatment Interaction • In general, expect differences in treatment effect across subgroups to be small relative to overall D • Quantitative Interaction- treatment effect varies in magnitude by subgroup, but is always in same direction • Qualitative Interaction- direction of treatment effect varies by subgroup, sometimes positive, sometimes negative DCRDP Advisory Committee Meeting January 6, 2003
Gail-Simon Test for Qualitative Interaction -likelihood ratio test-null hypothesis: treatment effect in all subgroups are in same direction-compare likelihood of data under null hypothesis to likelihood of data under alternative hypothesissee Gail and Simon (1985) Biometrics (41): 361-373 DCRDP Advisory Committee Meeting January 6, 2003
Gail-Simon Test for Qualitative Interaction Mechanics of test (assuming two subgroups):i) if point estimate of HR in both subgroups on same side of 1, then no evidence of qualitative interaction => test statistic is 0ii) if point estimates on opposite sides, standardize each by estimated standard error => test statistic is the one with smaller magnitude DCRDP Advisory Committee Meeting January 6, 2003
Summary- General Approach Subgroup analysis generally exploratoryDifferent types of interactions and methods for subgroup analysis Look to biological plausibility or evidence from other studies to confirm observations DCRDP Advisory Committee Meeting January 6, 2003
II. Data from Other Studies • Hypertension-losartan label: “COZAAR was effective in reducing blood pressure regardless of race, although the effect was somewhat less in black patients (usually a low-renin population)”-similar statement on some labels for beta-blockers DCRDP Advisory Committee Meeting January 6, 2003
Data from Other Studies • SOLVD-two large, randomized trials comparingACE-inhibitor enalapril with placebo in patientswith left ventricular dysfunction-authors reported a significant reduction in risk of hospitalization among white patients, but not in blackssee Exner et al. (2001) NEJM 344(18):1351 DCRDP Advisory Committee Meeting January 6, 2003
Data from Other Studies • V-Heft II-Patients with LVH, reduced exercise tolerance or history of heart failure randomized to enalapril or hydralazine + isosorbide dinitrate-authors reported that a reduction in mortality was observed in whites but not in blackssee Carson et al. (1999) J. Card Failure (5): 178 DCRDP Advisory Committee Meeting January 6, 2003
Data from Other Studies • “these conclusions ... must be viewed as hypothesis generating… A prospective trial of black patients would be needed to test this hypothesis” see Carson et al. (1999) J. Card Failure (5): 178 DCRDP Advisory Committee Meeting January 6, 2003
III. LIFE Study • 9193 hypertensive patients with LVH randomized to losartan or atenolol 533 of patients were Black, nearly all Blacks from US • Primary endpoint: stroke/MI/CV death overall estimated HR = 0.869 95% CI = (0.772, 0.979) p-value = 0.021difference mainly in stroke component DCRDP Advisory Committee Meeting January 6, 2003
Hazard Ratio and 95% CIs - Primary Endpoint DCRDP Advisory Committee Meeting January 6, 2003
Survival Curves- Primary Endpoint- By Race DCRDP Advisory Committee Meeting January 6, 2003
Annual Hazard Rates- Primary Endpoint- By Race DCRDP Advisory Committee Meeting January 6, 2003
Survival Curves- CV Mortality- By Race DCRDP Advisory Committee Meeting January 6, 2003
Survival Curves- MI- By Race DCRDP Advisory Committee Meeting January 6, 2003
Survival Curves- Stroke- By Race DCRDP Advisory Committee Meeting January 6, 2003
Relative Efficacy within Black Subgroups DCRDP Advisory Committee Meeting January 6, 2003
Gail-Simon Test • Nominal p-value for Black vs. Non-Black Qualitative Interaction = 0.016. • Impossible to correctly adjust this p-value for multiple comparisons post hoc. -3 subgroups pre-specified for special importance (U.S. region, Diabetics, ISH) -formal analysis plan would list all important subgroups and specify a method to correctly adjust for number of tests DCRDP Advisory Committee Meeting January 6, 2003
How Likely Is This Due to Chance? If true hazard ratio in all subgroups is 0.869: Prob[Blacks point estimate in opp. direction] = 0.28 Prob[Blacks, Whites, Age <65, Age >65, U.S., Non-U.S., Males, or Females have a point estimate in opp. direction] = 0.37 calculated as in Fleming T. (1995) Drug Info. J. (29):1681S-1687S DCRDP Advisory Committee Meeting January 6, 2003
How Likely Is This Due to Chance? If true hazard ratio in all subgroups is 0.869: Prob[CI for Blacks shows a reversal of effect] = 0.003 Prob[CI for Blacks, Whites, Age <65, Age >65, U.S., Non-U.S., Males, or Females shows a reversal of effect] = 0.005 DCRDP Advisory Committee Meeting January 6, 2003
Other Approaches • Assume effects in subgroups come from adistribution, but can vary. • Many assumptions needed- variability of effects?- common mean? • Cannot make strong conclusion without agreement on above. DCRDP Advisory Committee Meeting January 6, 2003
Conclusions • Not rare for a subgroup to have point estimate in wrong direction- but, rare to have CI in wrong direction. • Exactly how rare is impossible to determine from a post hoc analysis. Generally, post hoc analyses are hypothesis generating. DCRDP Advisory Committee Meeting January 6, 2003
Conclusions Factors that may decrease strength of evidence - Multiple subgroups; many chances to find unusual things - No pre-specified analysis to control for multiplicity Factors that may increase strength of evidence - Possible racial differences observed in other related studies - Consistency of effect within Black subgroups - Consistency in components of primary endpoint - Consistency across different analysis methods DCRDP Advisory Committee Meeting January 6, 2003
Acknowledgements CDER/Office of Biostatistics Jim Hung, Robert O’Neill, Charles Anello, and George Chi CDER/Division of Cardio-Renal Drug Products Doug Throckmorton, Tom Marciniak, Norman Stockbridge, Abraham Karkowsky and Jogarao Gobburu CBER and CDRH Gregory Campbell, Gene Pennello, Telba Irony, and David Banks DCRDP Advisory Committee Meeting January 6, 2003