Download
1 / 25
250 likes | 335 Views
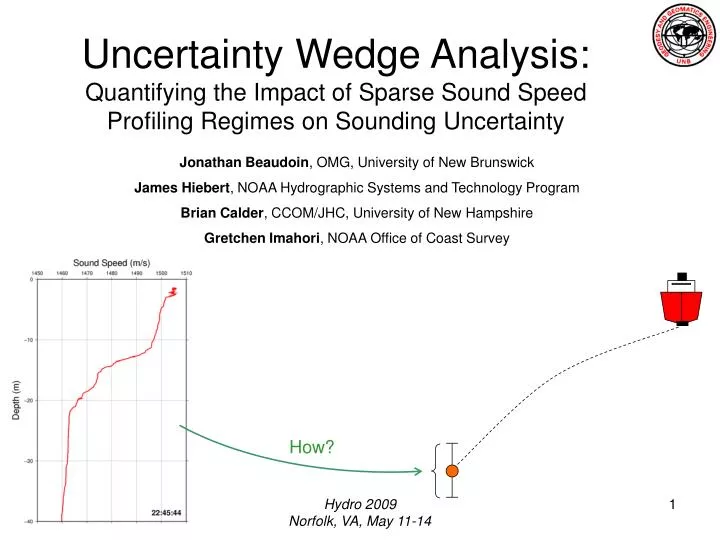
Uncertainty Wedge Analysis: Quantifying the Impact of Sparse Sound Speed Profiling Regimes on Sounding Uncertainty. Jonathan Beaudoin , OMG, University of New Brunswick James Hiebert , NOAA Hydrographic Systems and Technology Program Brian Calder , CCOM/JHC, University of New Hampshire

E N D
Uncertainty Wedge Analysis:Quantifying the Impact of Sparse Sound Speed Profiling Regimes on Sounding Uncertainty Jonathan Beaudoin, OMG, University of New Brunswick James Hiebert, NOAA Hydrographic Systems and Technology Program Brian Calder, CCOM/JHC, University of New Hampshire Gretchen Imahori, NOAA Office of Coast Survey How? Hydro 2009 Norfolk, VA, May 11-14
Moving Vessel Profilers (MVP) • MVP can be used to collect rich watercolumn datasets • By knowing too much about the watercolumn, we can ascertain the cost of not knowing enough • How important is the watermass variability? • How can we best sample the watermass? Hydro 2009 Norfolk, VA, May 11-14
Effect of Watercolumn Variability on Sounding Accuracy? D E MVP30 sound speed profiles from 1-2 hour site surveys in Rotterdam Waterway, March 2009 Hydro 2009 Norfolk, VA, May 11-14 B C A
Variability Analysis TWTT = 0.051 s Hydro 2009 Norfolk, VA, May 11-14
Variability Analysis +/- 0.4m A Variability Wedge (v-wedge) quantifies potential uncertainty. If you collected 1 cast only, this is the uncertainty you would suffer. Hydro 2009 Norfolk, VA, May 11-14 Note: Can also compute horizontal uncertainty
EM3002D watercolumn imagery of ship wreck courtesy of the Dutch Navy, processed by A. van der Werf Why Examine theENTIREPotential Sounding Space? ? • Two reasons: • Uncertainty due to watercolumn variability can be depth dependant. • The seafloor isn’t always flat. Hydro 2009 Norfolk, VA, May 11-14
Variability Analysis: Quantifying the Effect of Watercolumn Variability on Sounding Uncertainty Hydro 2009 Norfolk, VA, May 11-14
Draft 0.3m without surface sound speed probe Draft 4.0m without surface sound speed probe Draft 0.3m with surface sound speed probe Draft 4.0m with surface sound speed probe VA for Survey Design Hydro 2009 Norfolk, VA, May 11-14
Uncertainty Wedge Analysis (UWA) • VA allows us to quantify how “dangerous” a watermass is to work in • UWA lets us quantify the uncertainty cost associated with “what if” type analyses, e.g. • What if we used an XBT instead of a CTD? • What if we sampled only once every hour? • UWA needs some measure of “truth” against which the “what if” scenarios are measured Hydro 2009 Norfolk, VA, May 11-14
Bias Wedge Depth bias Comparing one cast to another allows for the construction of a bias wedge (b-wedge) which quantifies the bias that you’d suffer if you used an alternate cast in place of what you consider to be “truth” B-wedges are the building blocks of UWA; need a “set” of b-wedges to ascertain uncertainty associated with a UWA. Hydro 2009 Norfolk, VA, May 11-14 Depth Bias (m)
UWA: Sequential vs. Relative 1 vs. 3 1 vs. 4 1 vs. 5 1 vs. 6 Sequential Allows for estimation of uncertainty associated with watercolumn sampling rate 2 vs. 3 3 vs. 4 4 vs. 5 5 vs. 6 1 vs. 2 Relative Allows for estimation of uncertainty associated with “what if” scenarios 1 vs. 2 Sequences of b-wedges can quantify spatial and temporal evolution of uncertainty; compilations of b-wedges give a sense of “average” uncertainty Hydro 2009 Norfolk, VA, May 11-14
A ~50 MVP casts at low tide B Sequential UWA Example:REA in Rotterdam Waterway Mean Std. dev. B-wedges M-wedge S-wedge A Which environment would you rather survey in? B salinity salinity Mean Std. dev. 0 0 32 32 B-wedges M-wedge S-wedge ~7 km A B 20 m ~80 MVP casts on a rising tide Hydro 2009 Norfolk, VA, May 11-14
UWA Example:Spatial Analysis in Bay of Fundy 224 casts with ~2 min sampling interval Hydro 2009 Norfolk, VA, May 11-14
V-wedge VA Hydro 2009 Norfolk, VA, May 11-14
How did the MVP do?Sequential UWA V-wedge M-wedge S-wedge Not surprisingly, zero mean bias (we smile as often as we frown) Smaller standard deviation indicates that variability has been “captured” 5 vs. 6 1 vs. 2 2 vs. 3 3 vs. 4 4 vs. 5 Hydro 2009 Norfolk, VA, May 11-14
S-wedge M-wedge Not surprisingly, we get a significant average bias (frowning most of the time) As only 1 cast is used, we suffer full effect of variability (s-wedge equals v-wedge) What if? We only used the first cast of the day Hydro 2009 Norfolk, VA, May 11-14
What if? We “boxed in” the perimeter of the area M-wedge S-wedge The average bias disappears! Standard deviation improves slightly compared to “first cast of the day” Hydro 2009 Norfolk, VA, May 11-14
V-wedge Cast every 2 minutes First cast of the day “Box in” the perimeter Hydro 2009 Norfolk, VA, May 11-14
Hydro 2009 Norfolk, VA, May 11-14
Hydro 2009 Norfolk, VA, May 11-14
Hydro 2009 Norfolk, VA, May 11-14
Integration into NOAA Workflows VelociPy integrates UNB UWA/VA ability into ESS program • VelociPy allows • - Simple UWA/VA • temporal scatter plotting of profiles • other tools that give the field hydrographer better oceanographic information “on the fly” Hydro 2009 Norfolk, VA, May 11-14
VelociPy Video Demo Available to NOAA field units for testing this summer!! Hydro 2009 Norfolk, VA, May 11-14
Conclusion • VA and UWA can help surveyors make better decisions regarding sound speed profile sampling • Pre-analysis campaigns can be undertaken in areas where repetitive, high accuracy, surveys are the norm for safety of navigation or security • VA and UWA can augment the fidelity of uncertainty models We can be more certain about our uncertainty Hydro 2009 Norfolk, VA, May 11-14
Acknowledgements • NSERC and CFI funding of UNB Ocean Mapping Group • Sponsors of UNB Ocean Mapping Group • Fugro Pelagos • Kongsberg Maritime • Rijkswaterstaat (Dutch Public Works) • Route Survey Office, Canadian Navy • Royal Navy, U.K. • U.S. Geological Survey • NOAA grant NA05NOS4001153 • CHS Atlantic Region and Rijkswaterstaat for provision of key data sets Hydro 2009 Norfolk, VA, May 11-14