Download
1 / 36
360 likes | 473 Views
In-source laser spectroscopy of isotopes far from stability ( ISOLDE, CERN & IRIS, PNPI). Anatoly Barzakh PNPI. ISOLDE. IS 511: Shape coexistence in the lightest Tl isotopes studied by laser spectroscopy. IS 534: Beta-delayed fission, laser spectroscopy and shape-coexistence studies

E N D
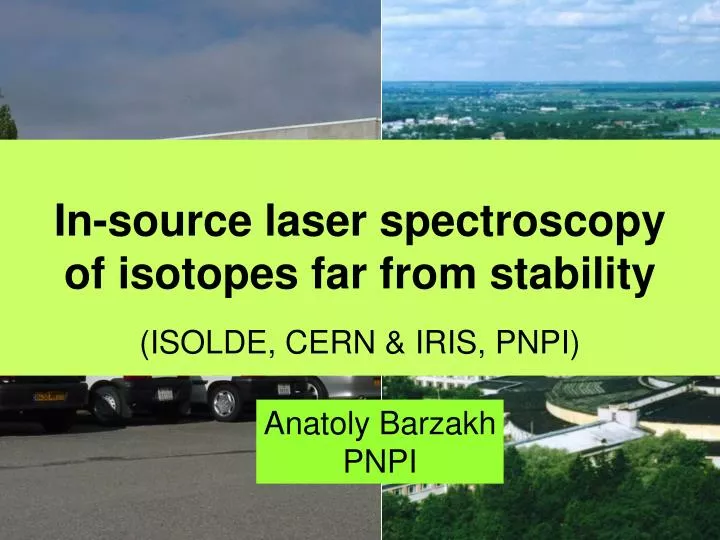
In-source laser spectroscopy of isotopes far from stability (ISOLDE, CERN & IRIS, PNPI) Anatoly Barzakh PNPI
ISOLDE IS 511:Shape coexistence in the lightest Tl isotopes studied by laser spectroscopy IS 534:Beta-delayed fission, laser spectroscopy and shape-coexistence studies with radioactive 85At beams IS 534 (addendum):Laser spectroscopy and shape-coexistence studies with radioactive 79Au beams • Shape Coexistence in the Lead Region studied by laser resonance spectroscopy • A collaboration of ~30 atomic and nuclear physicists • 12 institutions Preliminary results for At and Au isotopes!
Magnetic moments, hyperfine structure anomaly and mean squared charge radii of neutron deficient Tl isotopes IRIS
Laser Ion Source at ISOLDE Isotope/isomer shift 1 ppm A,Z A-1,Z • Isotope shift (IS), hyperfine structure (HFS) measurements: The wavelength of the narrow-band laser is scanned across the chosen transition. The photoion current at the collector of the mass separator increases at the resonance. • Detection of photoion current by measuring FC current, a//g or ToF spectra while scanning the frequency Target Hot Cavity Extractor Ion Source Mass separation Laser beams 60 kV Experiments Reaction products (neutral) Protons Ions Target material
Laser Ion Source at IRIS Laser beams ion source Mass separator target protons A substantial increase of the ionization efficiency can be achieved by decreasing of the inner diameter of the laser ion source tube with a corresponding focusing of the laser beam inside. At IRIS facility the laser spot as low as 1 mm in diameter can be provided due to a lens, placed in a distance of 2 m from the ion source
Detection: Windmill System at ISOLDE A. Andreyev et al., PRL 105, 252502 (2010) MINIBALL Ge cluster Si Annular Si Annular Si pure 50 keV beam from RILIS+ISOLDE Si a ff 50 keV beam from ISOLDE ff C-foil C-foils 20 mg/cm2 Si detectors • The WM technique requires waiting for the decay of the isotope (usually, α-decay). Not practical for long-lived or stable isotopes (or for β-decaying). • Setup: Si detectors from both sides of the C-foil • Large geometrical efficiency (up to 80%) • 2 fold fission fragment coincidences • ff-γ, γ-α, γ-γ, etc coincidences
Detection: MR-ToF MS at ISOLDE Multi-reflection time-of-flight mass separator (MR-ToF MS) ~1000 revolutions, ~35 ms, m/Δm ~ 105 • MR-ToF MS is not limited by decay scheme or long half-lives • MR-ToF MS offers a way to separate background for direct single-ion detection usingMCP (time scale: tens of ms). R. N. Wolf et al., Nucl. Instr. and Meth. A 686, 82-90 (2012), S. Kreim et al., INTC-P-299, IS 518 (2011)
Amplitudes of the components: Number of components and their relative intensities give the possibility to determine nuclear spin I F’2=I+1/2 Jf=1/2 F’1=I-1/2 Positions of the components: F2=I+1/2 Ji=1/2 F1=I-1/2
RILIS upgrade CVL to Nd:Yag Green Beams 90 W @ 532 nm UV beam 18 W @ 355 nm 10kHz rep rate 6 - 8 ns pulses
RILIS upgrade Dye+Ti:Sa system 3 Ti:Sa lasers: 5 GHz linewidth Up to 5 W output power 680 – 1030 nm (fund.) 35 ns pulse length Since the two systems can be used either independently or in combination,there exists far greater flexibility for switching from one ionization scheme to another or rapidly changing the scanning step. Laser ion source at ISOLDE Nd:YAG lasers Dye lasers Ti:Sa lasers
Isotope shift δA,A’: J. A. Bounds et al., Phys. Rev. C36, 2560 (1987); R. Menges et al., Z. Phys. A341 (1992) 475; H. A. Schuessler et al., Hfi 74 (1992)13 IS/hfs’s were previously measured for 535 nm transition with reliably established F and M for 186-207Tl:
Electronic factor and mass shift for 277 nm transition (IRIS) King plot F535nm, M535nmF277nm, M277nm Isotope shift δA,A’: Δσ for different transitions should lie on thestraight line with a slope Fλ1/ Fλ2
183Tl, I=1/2,T1/2=6.9 s 183Tl, I=1/2,T1/2=6.9 s 184Tl, I=2,T1/2=11 s 184Tl, I=2,T1/2=11 s 179Tl, I=1/2,T1/2= 0.23 s 180Tl, I=(4,5), T1/2=1.1 s 181Tl, I=1/2,T1/2=3.4 s 182Tl,I=(4,5), T1/2=3.1 s 183Tl, I=9/2, T1/2= 53 ms 184Tl, I=10, T1/2= 37 ms 185Tl, I=1/2,T1/2=19.5 s 185Tl, I=9/2,T1/2=1.8 s IRIS 186Tl, I=10, T1/2= 2.9 s IRIS & ISOLDE ISOLDE 195mTl, I=9/2,T1/2=3.6 s 197mTl, I=9/2,T1/2=0.54 s
Isomer selectivity for 184Tl (ISOLDE) hfs of the previously unknown isomer (I=10) with frequency of the narrow-band laser fixed at the marked positions isomer selectivity is obtained and one can investigate properties of the pure isomer state ground state hfs Hyperfine structures observed for 184Tl with different detection modes
Shape coexistence and charge radii in Pb region 85At? Po ISOLDE,T. Cocolios et al., PRL106, 052503 (2011) Pb ISOLDE, PRL98, 112502 (2007)H. De Witte et al. 2011: Tl isotopes: IS511 ISOLDE and IRIS (Gatchina) ?
Development and use of laser-ionized At beams at ISOLDE • Determination of optical lines and efficient photoionization scheme. First measurement of the ionization potential of the element At • Beta delayed fission of 194,196At • Charge radii and electromagnetic moments measurement for At isotopes
Photoionization scheme for the radioactive element At IP 532 nm 795 nm 216 nm Optimal photoionization scheme. Narrow band lasers for 1st and 2nd transitions At 6p48p(?), J=3/2 or 5/2 6p47s, J=3/2 6p5, J=3/2 In collaboration with TRIUMF-ISAC radioactive ion beam facilitywith the TRILIS laser ion source
Precise determination of the Ionization Potential for the radioactive element At IP (At)=9.317510(84) eV
IS534: Isomer selectivity for 197,198At Isomer selectivity enable ISOLTRAP team to measure masses of 197g,198gAt. Nuclear spectroscopic information for pure g.s. was obtained
IS534: Astatine HFS spectra IP 532 nm 795 nm 216 nm 1st step scanning is better for Δ<r2> extraction 2nd step scanning is better for hfs resolution (Q and μ determination). But to decipher these hfs’sone should know J for 58805 cm-1 level (5/2 or 3/2)
IS534:Additional atomic spectroscopic information for Astatine IP 532 nm F’2=2 Jf=3/2 F’2=3 795 nm Jf=5/2 F’1=1 F’1=2 216 nm 795 nm F2=2 F2=2 Ji=3/2 Ji=3/2 F1=1 F1=1 58805 cm-1, J=3/2 or 5/2 J=3/2 J=3/2 I=1/2 The number of peaks (4 rather than 3) unambiguously points to J=3/2 for 58805 cm-1 atomic state in At
King plot for 216 nm and 795 nm lines in At 197m 207 197g 198g 198m 217 F216/F795(At)=-2.26(8) compare with F256/F843(Po)=-2.241(7) for similar transitions in Po Isotope shift δA,A’: Δσ for different transitions should lie on a straight line with a slope Fλ1/ Fλ2
IS534October 2012:Charge radii of At isotopes WM FC WM MR-ToF Astatine seems to follow Polonium δ<r2> trend — i.e. there is the same early onset of deformation after N=113. Data for lighter isotopes are necessary to verify this conclusion
October 2012:IS534 experiment at ISOLDE – Au isotopes • Are the light Au isotopes deformed? • What are the spins of ground and isomeric states?
Au hfs spectra autoionizing state IP 674.1 nm 306.6 nm 267.7 nm Au ionization scheme
Is it possible to discriminate between I=1/2 and I=3/2 for Au isotopes by hfs spectra? F’2=1 Jf=1/2 F’2 F’1 F’1=0 I=1/2 0—>0 transition is forbidden! F2 F2=1 Ji=1/2 F1 F1=0 Only 3 rather than usual 4 peaks will be seen in the hfs spectra of isotopes with I=1/2 (for I=3/2 — 4 peaks)
IS534: Hyperfine Structure Scans for 177,179Au 179Au (WM) 177Au (WM) 179Au 3/2+ calculated 179Au 1/2+ calculated Number of peaks and their intensities ratio fix ground state spins of 177,179Au: I=1/2
Why is 1/2+1/2+181Tl177Au a decay hindered? HF>3 I=3/2 m~1.6mN , pure sph. 3s1/2, (as in the heavier Tl’s) 1/2+ m~1.1mN , (preliminary) mixed/def/triaxial 3s1/2,/d3/2 1/2+ Plot from A.Andreyev et al., PRC 80, 024302 (2009)
Summary: Charge Radii in Pb region • At seems to follow Po unusual δ<r2> trend • “Back to sphericity” in the lightest Au isotopes • Magnetic/quadrupole moments will be deduced • Large amount of by-product nuclear spectroscopic information on At and Au and their daughter products
Conclusions • IS’s and hfs’s for 10 At isotopes (isomers) were measured for two transitions, 216 nmand 795 nm, The fast switching between these modes of scanning provides much more flexibility to experiment and gives more reliable and complementary data for analysis (especially for atoms without known spectroscopic information). • MR-ToF mass separator was used for photo-ions detection for the first time. This method seems to be indispensable for measurements with great surface ionized background and for long lived isotopes with great yield and/or absence of alpha decay mode. • Using WM installation for photo-ions detection gives the possibility to obtain wealth of additional nuclear spectroscopic information (decay schemes, spin and parity assignment etc.) without supplementary time requirement. • Coordinated (ISOLDE&IRIS) program for Tl isotopes investigation enabled us to use both installation more efficiently. • Very interesting results for At and Au isotopes by IS/hfs measurements were obtained: “inverse jump of deformation”, unexpected spin assignments, shape isomers etc. The study of shape coexistence in the lead region will be continued: to go further for Au’s, to fill the gaps and go further for At’s (ISOLDE), to investigate Bi isotopes (IRIS), etc.
Additional nuclear spectroscopic information from Tl isotopes decay IRIS: 30 new 189Hg γ-lines from 189mTl decay are unambiguously identified by hfs patternand their relative intensities are determined ISOLDE: decay schemes for some Tl isotopes are determined
183Tl, I=1/2,T1/2=6.9 s 184Tl, I=2,T1/2=11 s 185Tl, I=1/2,T1/2=19.5 s 186Tl, I=7,T1/2=27.5 s 188Tl, I=7,T1/2=71 s 185Tl, I=9/2,T1/2=1.8 s 186Tl, I=10,T1/2=2.9 s 187Tl, I=9/2,T1/2=15.6 s 190Tl, I=7,T1/2=3.7 m 192Tl, I=7,T1/2=10.8 m 194Tl, I=7,T1/2=32.8 m 189Tl, I=9/2,T1/2=84 s 190Tl, I=2,T1/2=2.6 m 191Tl, I=9/2,T1/2=5.2 m 192Tl, I=2,T1/2=9.6 m 193Tl, I=9/2,T1/2=2.1 m 194Tl, I=2,T1/2=33 m repeated for another atomic transition (276.9 nm) for King-plot calibration 195Tl, I=9/2,T1/2=3.6 s 197Tl, I=9/2,T1/2=0.54 s previously measured for 207Tl, I=1/2,T1/2=4.77 m 203Tl, I=1/2,stable transition (535.2 nm) …