Download
1 / 11
120 likes | 268 Views
Monitoring Foodservice Operations. Actual vs. Standard Food Cost. Establishing Standards. Setting standards are somewhat like goals. In setting standards within a foodservice environment, management needs to consciously consider the level of standards to adopt :

E N D
Monitoring Foodservice Operations Actual vs. Standard Food Cost
Establishing Standards • Setting standards are somewhat like goals. • In setting standards within a foodservice environment, managementneeds to consciously consider the level of standards to adopt: • Achievable standards are realistically within reach. Such standards takeinto account normal spoilage and inefficiency. • Ideal standards may never be reached. They represent what will resultin a state of perfection (e.g., no spoiled goods, no worker errors, etc.). • Many foodservice operations avoid ideal standards because they fearthat employees will see ideal standards as meaningless since they cannothope to achieve them.
Standard Cost • Management needs to adjust the potential food cost to include waste and spoilage that occurs during normal preparation, as well as an allowance for complimentary or discounted meals to employees and guests. • Are used as target costs (or basis for comparison with the actual costs) • Are developed from historical dataanalysis. • They almost always vary from actual costs, because every situation has its share of unpredictable factors.
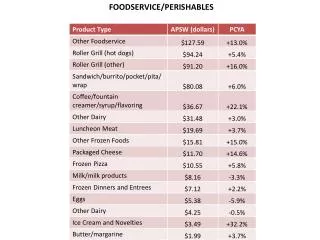
Pre-cost Menu abstract • Is a sheet based on standard costs • Contains sales on one side and the food cost % in the other column. (referred to daily food cost % as well) • Another column is added, known as forecast.
Menu Abstract Standard Cost/ Sales = Standard Cost % Total Standard Cost/Total Sales = Standard Cost %
Menu Abstract Conclusion • Standard cost and sales figures may be raised or lowered, dependingon which is desirable, by the following means: • Sales prices may be changed. • Standard portion costs may be changed by altering portion standards:sizes, ingredients, recipes, or some combination of these. • Menu items may be added or eliminated. • With these totals available, it is easy to project gross profit and standard cost percent. • If the projections are judged satisfactory, the manager can send the menu to aprinter. • If they are not considered satisfactory, various changes can be made,because production has not yet started. • Essentially, a new forecast can be developed.
Volume forecast and sales forecast • Is a list of projected sales volume. • Items are listed in terms of units forecasted to be sold. • Items are compared to with actual units sold to compute the difference (+ or -) • The forecasted volume is later multiplied by the cost price which becomes the sales forecast. • An acceptable variance will range from half to three percentage points of food sales. • The difference between actual food cost and standard food cost reflects inefficiencies that should have been controlled by management.
Volume ForecastDaily Comparison Formula: Actual Sales – Sales Forecast = Difference
Food Cost Variances • Unfavorable variances signal waste, or inefficiency of some sort.However, one must also be wary of favorable variances. • Favorable variances canmean that food personnel are not following standardized recipes (preparing Fruits de Mer with cod fish instead of lobster), serving portions that are smaller than standard (serving 8 ounce steaks instead of 12 ounce steaks), and so on.
3 Reasons for Comparing Forecast vs. Actual Figures • To see if a menu item has sold in greater quantities than forecasted. • To determine the extent to which forecasts are wrong. • To see the extent to which forecasting techniques can be improved.
Actual Food cost • The actual food cost percentage appears on the monthly income statement. This is the cost of the food consumed by your customers, and does not include employee meals or spoilage.Although the actual food cost indicates what the food cost is currently running, it has little value unless the operator knows what the target percentage should be. • http://hotelmule.com/management/html/56/n-1656-8.html