Download
1 / 27
280 likes | 467 Views
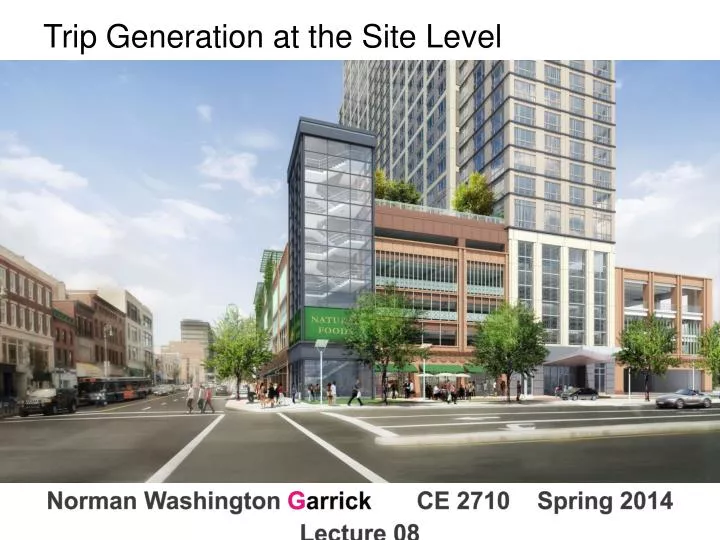
Trip Generation at the Site Level. Norman Washington G arrick CE 2710 Spring 2014 Lecture 08. Trip Rate Analysis. Typically used to estimate trips from sites rather than for whole cities or region Used for so-called traffic impact study. Trip Rate Analysis. Trip-Rate Analysis

E N D
Trip Generation at the Site Level Norman Washington GarrickCE 2710 Spring 2014 Lecture 08
Trip Rate Analysis • Typically used to estimate trips from sites rather than for whole cities or region • Used for so-called traffic impact study Norman W. Garrick
Trip Rate Analysis • Trip-Rate Analysis Trip rate is estimated based on the characteristics of the trip generator or trip attractor. • Example • The characteristics of the trip generator is given in 1000 SQ. FT. • And the trip generation rate for each generator is given as TRIPS PER 1000 SQ. FT. • For example • Residential: Total Sq. Ft. = 2744 1000 sq. ft., Trip Gen. Rate = 2.4 trips/1000 sq.ft • TOTAL NO. of TRIP from residential land use = 2744*2.4 = 6586 Trips Norman W. Garrick
ITE Trip Generation Manual Norman W. Garrick
ITE Trip Generation ManualLow Rise Apartment, Weekday Norman W. Garrick
ITE Trip Generation ManualLow Rise Apartment, Weekday 19 data points! Norman W. Garrick
ITE Trip Generation ManualLimitations The data contained in Trip Generation are, by definition, from single-use developments where virtually all access is by private automobile and all parking is accommodated on site. For new developments with characteristics that reduce automobile use--located close to transit, containing a mix of uses, or charging for parking--the use of unadjusted average ITE trip-generation rates will in many cases drastically overestimate the amount of traffic generated. A corner store with no parking across from a subway station in a dense, transit-oriented development is often forecast to have the same impact as a 7-Eleven on a suburban highway. Ref:Playing the numbers game: when it comes to TODs, trip-generation figures can make all the difference by Millard-Ball, Adam, Siegman, Patrick http://www.entrepreneur.com/tradejournals/article/158211933.html Norman W. Garrick
ITE Trip Generation ManualDangers of Overbuilding "The traffic engineering profession is just waking up to the fact that one can overbuild infrastructure so it no longer serves the community," continues Walters (a California-based principal at Fehr & Peers Associates). "When one tries to design facilities to cater to the maximum demand that may occur, one can end up with too much. "It's true of parking," Walters says. "It's also true of streets," where oversizing can lead to more lanes, wider lanes, and longer signal phases than are strictly warranted. This not only adds to development costs but reduces the amount of space available for trees and other amenities, and creates physical barriers in the community. Ref:Playing the numbers game: when it comes to TODs, trip-generation figures can make all the difference by Millard-Ball, Adam, Siegman, Patrick http://www.entrepreneur.com/tradejournals/article/158211933.html Norman W. Garrick
Storrs Center Model Norman W. Garrick
Storrs Center Model Village Road Norman W. Garrick
Storrs Center Norman W. Garrick
Storrs Center Google Earth The Site Norman W. Garrick
Wetlands Forest Reserve Storrs Center Google Earth The Site Constraints Norman W. Garrick
Storrs Center Google Earth The Site Built Area Norman W. Garrick
Storrs Center Model Village Road Norman W. Garrick
ITE Trip Generation Manual Proposed size of project Using TG Manual for Storrs Center Estimated number of trip ends = 24,600 Norman W. Garrick
Using TG Manual in Storrs Centerwith Correction for Mixed Use Estimated number of trip ends = 15,900 Norman W. Garrick
This estimate almost lead to the unnecessary widening of Storrs Road. The widen was prevent by change the design of the town center by providing two roads into the center not one as was originally design.
Storrs Center 195 Problem Norman W. Garrick
Storrs Center Importance of the Network Norman W. Garrick
Modifying ITE for Mix Use The ITE procedure estimate 24,600 trip ends for Storrs Center In many projects this number is assumed to be the number of new VEHICLE trips Because Storrs Center is a mixed use, walking center that is close to the university the assumption that these are all vehicles is significant wrong.
Estimating Number of New Vehicle Trips Factors Affect % of Trips that are Vehicle Trips • Mode Share • Mixed Use (internal capture) • Pass By Trips • Vehicle Occupancy Rate
Estimating Reduction from ITEfor Storrs Mode Share – 50 % (walk, bike, transit) Mixed Use (internal capture) – 35 % Pass By Trips – 25 % Vehicle Occupancy Rate – 10 % Estimated New Vehicle Trips = 4700 per day
Estimating Number of New Vehicle Tripsfor Storrs Mode Share = 0.5 * 24,600 = 12,300 Number of Vehicle Trips Accounting for Mode Share = 24,600 – (0.5*24,600) = 12,300 Amount of reduction due to Mixed Use = 0.35*12,300 = 4,305 Amount of reduction due to Pass By Trips = 0.25*12,300 = 3,075 Amount of reduction due to Vehicle Occupancy Rate = 0.10*12,300 = 1,230 Estimated New Vehicle Trips = 12,300 – (4,305 + 3,075 + 1,230) = 3,690
360 State, New Haven trip Generation over predict trips The 360 State Street was estimated to produce 674 PM peak hour vehicle trips Requiring the construction of 500 parking spaces Live monitoring shows only 116 trips (17% of what was predicted) - Mixed Use Trip Generation Model (New Haven and SCRCOG)