Download
1 / 17
190 likes | 323 Views
CE 2710 Transportation Engineering. Wesley Marshall, P.E. University of Connecticut March 2009. The Four-Step Model. The Basic Transportation Model…. Inputs. Study Area Zones Attributes of Zones Socioeconomic Data Land Use Data “Cost” of Travel btw. Zones The Road Network.

E N D
CE 2710Transportation Engineering Wesley Marshall, P.E. University of ConnecticutMarch 2009 The Four-Step Model
The Basic Transportation Model… Inputs • Study Area Zones • Attributes of Zones • Socioeconomic Data • Land Use Data • “Cost” of Travel btw. Zones • The Road Network • Traffic Volume by Road Link • Mode Splits • Emissions Outputs
What’s in the Black Box? The Four-Step Model
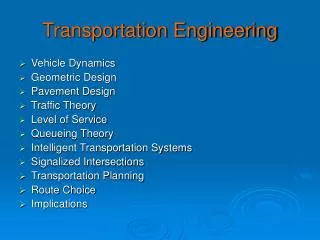
The Four-Step Modeling Process… • Trip Generation • Trip Distribution • Mode Choice • Trip Assignment
TRIP GENERATION } Input: - No. of Housing Units - Office, Industrial SF - HH Size - Income - No. of Cars Land Use Data Household Socioeconomic Data Examples of HH socioeconomic data } Examples of land use data Iterative Process Output: - i.e. columns of trip productions and trip attractions Trip Ends by purpose TRIP DISTRIBUTION Input: Trip Ends by purpose Output: - a matrix of trips between each TAZ… also called a “trip table” Trip Interchanges MODE CHOICE Input: Trip Interchanges Output: Trip Table by Mode - a matrix of trips between each TAZ for each type of mode TRIP ASSIGNMENT Input: Trip Table by Mode Output: Daily Link Traffic Volumes - i.e. traffic flows on network, ridership on transit lines
P/A versus O/D Trip Production Home end of the trip (where the need to make a trip is generated) Trip Attraction Non-home end of the trip (where the need to make a trip is satisfied) Trip Origin # of trips that begin in a zone Trip Destination # of trips the end in a zone
Zone 1Residential Zone 2Non-Residential Zone 1 = Production & Origin Zone 1 = Production & Destination AM Peak Hour Trip PM Peak Hour Trip Zone 2 = Attraction & Destination Zone 2 = Attraction & Origin
Some General Problems with the Conventional Methodology • Focus on vehicular traffic • Better models typically have a transit component • Typically forecasts huge increases in traffic • Leads to engineers building bigger roads to accommodate “forecast” traffic • Which leads to induced traffic and congestion… right back where we started when we needed the bigger roads in the first place
Some General Problems with the Conventional Methodology • Pedestrians and bicyclists are rarely included • Level of geography is difficult for non-motorized modes • Network scale is insignificant • Input variables are too limited
4-Step Model Problem Given the zone data above and the tables/charts on the following page, Find the vehicle flows on the road network to the left using “all-or-nothing” traffic assignment. This will require completing all four steps of the transportation planning process…
Pi Aj Fij Tij = ΣAjFij (Productions)(Attractions)(Friction Factor) = Sum of the (Attractions x Friction Factors) of the Zones Basic Step-By-Step Process • Trip Generation • Using the socioeconomic & land use data along with the cross-classification tables, come up with the number of trip productions & attractions for each zone… • Trip Distribution • Create trip interchange table based upon “friction” between zones using the travel time matrix, the F-Factor graph, and the Gravity Model… Gravity Model • Mode Choice • Create a separate trip interchange table for each mode based upon, in this case, the relationship of land use household density the percentage of people walking & biking… • Trip Assignment • Distribute the vehicle trips to the street network using “all-or-nothing” traffic assignment by assuming that all trips are accommodated on the shortest possible path between zones…
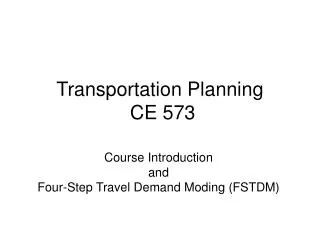
2 1 Travel Time = 2 Travel Time = 6 Travel Time = 5 Travel Time = 2 3 4 Travel Time = 5
586 + 97 = 683 2 1 Travel Time = 2 787 + 159 + 40 = 986 159 + 658 = 817 40 + 66 = 106 Travel Time = 6 97 + 215 = 312 Travel Time = 5 0 95 Travel Time = 2 527 32 3 4 Travel Time = 5 131
2 1 3 4