Download
1 / 9
90 likes | 214 Views
Energy Story P&G and Albert Heijn Project Evaluation highlights: 2007 - 2010. Organisations background. Established in 1837 Manufacturer of 200+ brands 24 Billion Dollar brands $80 billion in sales 130,000 employees. Established in 1887 835 stores

E N D
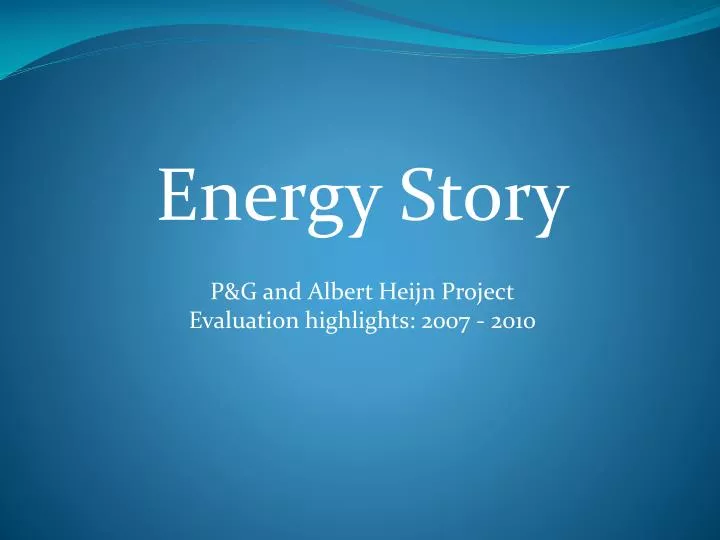
Energy Story P&G and Albert Heijn Project Evaluation highlights: 2007 - 2010
Organisations background • Established in 1837 • Manufacturer of 200+ brands • 24 Billion Dollar brands • $80 billion in sales • 130,000 employees • Established in 1887 • 835 stores • Compact hypermarkets, supermarkets, convenience stores and home shopping • € 10 billion in sales • 55.000 employees
Project Overview Before project Batteries sold from behind customer service desk Sales slow Selling costs high Shrink low in absolute and % (0.1%) After project Batteries moved to open sales at checkouts Sales increased by 86% Staff costs lowered Shrink - Absolute shrink valued at cost of goods increases by 3714% and shrink as % of Sales moves from 0.1% to 2% of sales Net Profit increases by 83%
In Store Images Before project (behind counter) After project (open sales)
Christmas Summer Losses in batteries as a % of sales sold from counter Losses in batteries as a % of sales sold in open sales Sales from counter Sales in open sales near check-out Losses in batteries as a % of sales sold in open sales near check-out (linear)
Catalyst for Further Sales While store managers had confidence to move to open sales at the checkout, the buyer had continued challenges getting store manager support for secondary sites because of high shrink (12% of sales) In response, P&G developed the anti-theft pack that was more difficult for thieves to conceal With this solution, store manager confidence was restored and secondary sites were agreed.
Secondary Site Results Unit included special pack features in week 18-19 and 27-28 (in Bonus folder) and a 4+4 free pack feature in week 30 (shipments FY0910) Full support from Store managers Delivered a 33% increase in sales
Questions to the audience • What are the good and bad take-aways? • What would be project improvement opportunities? • What could be next steps?
Next Steps • Continue to expand / sustain open sales on batteries • Address hot stores shrink: • Assess scale of organised thieves threat. • Assess other possible explanations, seasonality? • Identify new solutions • Assess anti-theft pack – return on investment • Reflect on how learning’s could be reapplied to other hot categories