Download
1 / 18
190 likes | 363 Views
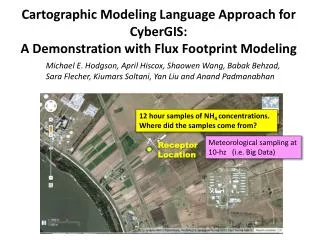
RESPONDING TO CLIMATE CHANGE SCENARIOS: A CARTOGRAPHIC MODELING APPROACH FOR SPATIAL PLANNING. ASIA GEOSPATIAL FORUM. HANOI. 19 SEPTEMBER 2012 Sarah Remmei Environmental Planner & Climate Change Specialist sarah.r@spatialdecisions.in Spatial Decisions

E N D
RESPONDING TO CLIMATE CHANGE SCENARIOS:A CARTOGRAPHIC MODELING APPROACH FOR SPATIAL PLANNING ASIA GEOSPATIAL FORUM. HANOI. 19 SEPTEMBER 2012 Sarah Remmei Environmental Planner & Climate Change Specialist sarah.r@spatialdecisions.in Spatial Decisions VIETNAM: 68c Tran Quang Dieu, Dong Da , Hanoi INDIA: B30 Kailash Colony, New Delhi
Understanding Urban Growth and Climate Change • Paradigm I: Effect of Climate Change on Urban Planning • Urban areas will continue to grow based on demographic and economic growth • Typically we need to develop master plans for expansion of existing areas • These master plans are influenced by understanding areas that are likely to be affected by sea level rise/ increased flood potential from storm events. • Consequently, climate change impacts will shape the geospatial nature of urbanization at a regional and national level
Understanding Urban Growth and Climate Change • Paradigm II: Effect of Urban Growth on Climate Change • Urban areas generate GHG’s contributing to climate change impacts • Better urban planning can help reduce GHG emissions • By interventions like transit oriented development, distribution of open green spaces, improved storm water management through green infrastructure, and by more energy efficient design we can reduce the carbon footprint of urbanization • Collectively, better urban growth strategies can reduce the effect on climate change
The countries like Vietnam where sea level rise and storm based flooding are major anticipated climate change impacts. Examining climate change scenarios developed by different research groups and organizations the where (location and extent) and when (now, near future, or distant future) of these impacts varies. With growing urban populations it is expected that either the existing towns will grow or new urban areas will have to be developed to address the requirement for urban expansion Considering the significant cost and the timeline required for urban areas and associated infrastructure, these FUTURE investments must be planned so as not to be in the potentially affected areas. Climate Change Impacts Urban Growth Graphic: The Earth Institute, Columbia University
Varying inundation zones based on different sea level rise scenarios Source: World Bank 2007
Building Blocks for Decision Models using GIS • In the context of a geospatial understanding of the country, the various scenarios, ranging from conservative to extreme, such as ranging from 60 cm sea level rise to 1 m sea level rise may all be considered as data layers identifying a flood hazard • When examining a timeline scenario of the year 2050, the lower flood levels can be expected to have a higher probability of happening, and higher flood levels having a relatively lower probability of occurrence. • These probabilities can be considered to be best represented by cartographic (map) data layers. • The probability scenarios can be further sub-divided into a sub-set of time slices, with lower flood probability expected in this decade and higher flood probability in successive decades. • Geospatially, this extent and time series representation of flood scenarios becomes a collection of data layers providing a probabilistic representation of flooding. • This represents the first step in developing our planning decision models
Representationally Simplistically, each flood scenario can be assigned a probability value. Bringing these probabilities together as a mathematical model, the probability value for each overlapping area is added up This gives a cumulative probability value that can be used to determine the appropriateness, or rather the suitability for urban development as high, moderate, or low A. Low flooding scenario; High Probability 0 10 15 0 5 B. High flooding scenario; Low Probability C. Multiple flooding scenarios; Cumulative Probability 5 0
Decision Models for Urban Growth • This representation example is structured into geospatial decision models, termed as Cartographic Models, to capture the influence of spatial and temporal variability in urban and regional planning. • Such models are developed as “raster” GIS data layers to represent the scenarios under consideration. • The process of mathematically “adding” these relative probabilities, assigned as qualitative measures for decision making, is achieved through “map algebra” functionality. • By assimilating multiple such considerations into raster data layers, and assigning relative values indicative of higher or lower suitability for urban development, we establish simple, yet highly versatile GIS-based decision models that can address multiple criteria and changing data sets to refine and enhance development decisions.
Understanding Cartographic Modeling • “Cartographic” models are GIS-based analytical models that can be used to describe the current land based information as multiple individual data layers in a raster-GIS data structure. • These data layers are linked together into a mathematical model that uses simple map-algebra to assign numerical values to each data layer and build a “suitability model” that helps identify areas most suitable for different forms of urban development. • The map-algebra based cartographic model represents our informed value judgment about the relative importance of each data layer in a decision process. • Cartographic = Map
Map Algebra Map Algebra provides the computational basis for integrating cartographic data layers that represent decision criteria These cartographic representations of relationships that influence our estimation of risk probability are aggregated into a “decision model” using map algebra This aggregation can be based on simple mathematical functions that best represent interactions between the cartographic layers.
Building Suitability Models Bringing together different criteria, such as …. • Protection of environmentally sensitive areas • Protection of ground water recharge areas • Development on non-fertile lands • Development in proximity to planned infrastructure ….. is used to develop decision models to identify areas that are most suitable, moderately suitable, least suitable for development
Climate Responsive Urban Development Zones • Based upon varying modeling inputs we generate “best fit” scenarios for urbanization across the selected region of study • Decision models hold the advantage of being re-processed as new and more detailed information is available on climate change scenarios • This map graphic shows the most suitable possible locations for urban development, based on a selected set of criteria.
Changing Paradigms:Reducing Urban Climate Change Impacts • Urban growth and development affects the climate change scenarios by the increased carbon footprint, energy consumption, and consequent generation of GHGs • In the absence of qualitative assessment of the relative difference GHG emissions by the type and extent of urban development, it is difficult to envision the benefit of improved urban development practices on reducing climate change impacts • GIS-based analytical models, with GHG measures linked to urbanization actions can provide us with a “interactive”understanding of the action (of selecting a particular typology) and the reaction (the effect of increased or decreased GHG emissions). • Such a system provides for understanding the inter-relation between urban development typologies and GHG emissions can be achieved through a GIS-based analytical process, optimizing urbanization for minimal climate change impacts
Changing Paradigms: Climate Change Impacts of Urban Growth • Using GIS we can lower the carbon footprint of urban growth by: • Adopting urban growth forms that can minimize the environmental impact by selecting areas that are environmentally sensitive • Selecting areas that are not likely to be impacted by sea level rise/ floods to direct investment in urban area development and infrastructure that is resilient to climate change • Plan the distribution of pervious open spaces for managing rain water as a fresh water resource • Developing open green spaces to lower proximal ambient temperatures and achieve reduction of energy demands • Plan for public-transport oriented development that dramatically reduces energy demand for local transport • Map location of distribution of energy efficient built structures to reduce energy demand
Urban Growth – GHG Linkages • Building ordinal scales of measure defining GHG emissions by urbanization typology will help making better decisions at a regional scale. • Reduce GHG’s by: • Protecting environmentally sensitive areas • Green infrastructure for storm water management • Introducing public transport based urban development • Each of these interventions may cost more in the short term, but have significant long term benefits • A GIS-decision tool that integrates GHG reductions with Cost implications can be a valuable planning tool
Thank you for your attention! NOTE: The information presented and the GIS-modeling tools displayed in this presentation are the Intellectual Property of Spatial Decisions and may not be used or reproduced without written authorization.