Download
1 / 27
270 likes | 385 Views
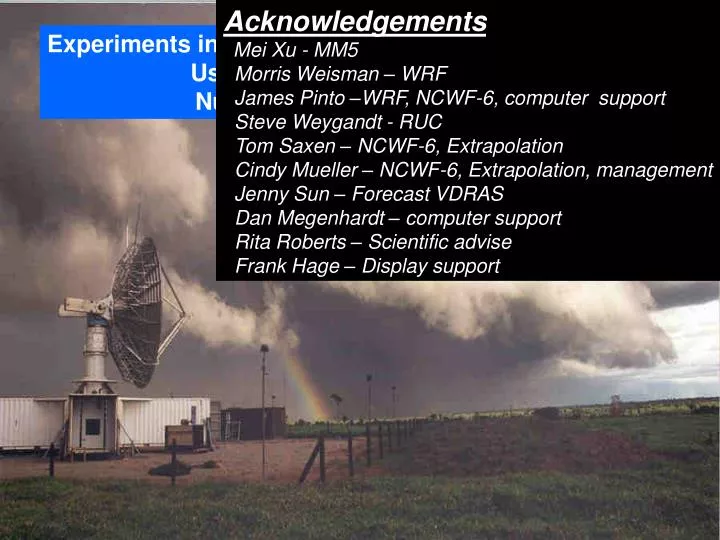
Acknowledgements Mei Xu - MM5 Morris Weisman – WRF James Pinto –WRF, NCWF-6, computer support Steve Weygandt - RUC Tom Saxen – NCWF-6, Extrapolation Cindy Mueller – NCWF-6, Extrapolation, management Jenny Sun – Forecast VDRAS Dan Megenhardt – computer support

E N D
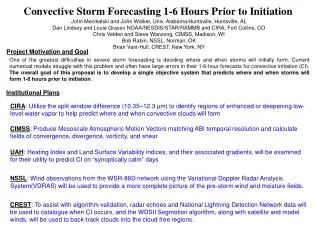
Acknowledgements Mei Xu - MM5 Morris Weisman – WRF James Pinto –WRF, NCWF-6, computer support Steve Weygandt - RUC Tom Saxen – NCWF-6, Extrapolation Cindy Mueller – NCWF-6, Extrapolation, management Jenny Sun – Forecast VDRAS Dan Megenhardt – computer support Rita Roberts – Scientific advise Frank Hage – Display support Experiments in 1-6 h Forecasting of Convective Storms Using Radar Extrapolation and Numerical Weather Prediction
Overarching Goal Blend Numerical Forecasting Methods and Observational methods To improve 1-6 h nowcasting
Predictability Blended Extrapolation Forecast Skill NWP Best Forecast Length
Challenge - How to blend extrapolation and model nowcast Numerical Model Forecast Extrapolation Forecast
To meet this challenge – NCAR conducted a forecast extravaganza this summer 8 methods that produce 1-6h forecasts 4 numerical and 4 observational Forecasts evaluated with the objective of developing ideas for blending numerical and observational
Study area June 2005
Observational Techniques Examined • Probabilities • Extrapolation plus smart trending • (synoptic situation and time of day) Extrapolation
NWP Techniques Examined • Probabilities • 20 km grid • 3 h forecast cycle • ACARS, VAD, profiler, • GOES precip water) The point is- State of the art techniques were available • 4 km grid • 24h forecast cycle • initialized with 40km • ETA • nested grid • 3h forecast cycle • observational nudging • radar data assimilation • (conus mosaic of reflectivity)
Forecast Quality Definitions Wilson subjective categories 1 – forecast and observed almost perfect overlap. 2 – majority of observed and forecast echoes overlap or offsets <50 km . 3- forecast and observed look similar but there are a number of echo offsets and several areas maybe missing or extra. 4 – the forecasts and observed are significantly different with very little overlap; but some features are suggestive of what actually occurred. 5- There is no resemblance to forecast and observed.
Examples of Forecast Quality Forecast Observed Quality = 4.0 Quality = 2.0 Quality = 3.0 Quality = 5.0
Quality of forecasts for echo • Existing at forecast time. • 2. Quality of NWP forecasts of • initiation • 3. Quality of NWP forecasts of • change in area size
1. Echo present at forecast time Forecast Quality Best Extrapolation NWP
Forecast observed Quality = 4.0
Cross over region GRID MESH 20 km Jun-Oct 2002 1.0 Accuracy of Rainfall Nowcasts .8 Extrapolation >1 mm/h .6 Critical Success Index (CSI) .4 .2 NWP 0 1 2 3 4 5 6 Forecast Length, hours Courtesy of Shingo Yamada JMA
2. Initiation Forecasts Best NWP Results
observed forecast 3. Area Size Trend Forecasts 2, 4 and 6 hr forecasts of trend in area size 7 Trend Categories g+ large growth g medium growth g- small growth nc no change d- small dissipation d medium dissipation d+ large dissipation Error 2 categories
observed forecast 3. Area Size Trend Forecasts 2, 4 and 6 hr forecasts of trend in area size 7 Trend Categories g+ large growth g medium growth g- small growth nc no change d- small dissipation d medium dissipation d+ large dissipation Error 2 categories
observed forecast 3. Area Size Trend Forecasts 2, 4 and 6 hr forecasts of trend in area size 7 Trend Categories g+ large growth g medium growth g- small growth nc no change d- small dissipation d medium dissipation d+ large dissipation Error 6 categories
3. Area Size Trend Forecasts Best NWP results 6 h Best Worse
Summary Overarching Goal Blend Numerical Forecasting Methods and Observational methods To improve 1-6 h nowcasting
Summary 1. Model – frequent cycling (3hr), assimilate radar reflectivity 2. Initiation – Give full weight to model 3. Existing storms – Extrapolate and trend area size based on model trend (more weight for dissipation trend) Unfinished – examine model and extrapolation predictability stratified by precipitation organization, synoptic situation and time of day.
6-hour trend Number cases Trend Category Area Size Trends 2-hour trend 4-hour trend g+ large growth g medium growth g- small growth nc no change d- small dissipation d medium dissipation d+ large dissipation
Quality = 1.5 Observed Forecast