Download
1 / 1
10 likes | 181 Views
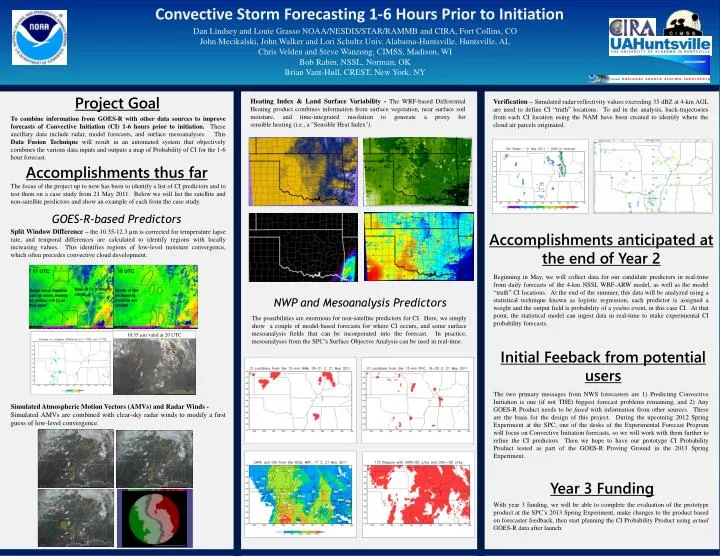
Convective Storm Forecasting 1-6 Hours Prior to Initiation. Dan Lindsey and Louie Grasso NOAA/NESDIS/STAR/RAMMB and CIRA, Fort Collins, CO John Mecikalski, John Walker and Lori Schultz Univ. Alabama-Huntsville, Huntsville, AL Chris Velden and Steve Wanzong, CIMSS, Madison, WI

E N D
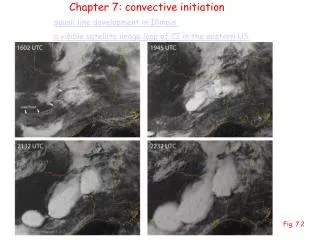
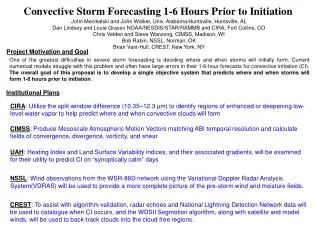
Convective Storm Forecasting 1-6 Hours Prior to Initiation Dan Lindsey and Louie Grasso NOAA/NESDIS/STAR/RAMMB and CIRA, Fort Collins, CO John Mecikalski, John Walker and Lori Schultz Univ. Alabama-Huntsville, Huntsville, AL Chris Velden and Steve Wanzong, CIMSS, Madison, WI Bob Rabin, NSSL, Norman, OK Brian Vant-Hull, CREST, New York, NY Accomplishments anticipated at the end of Year 2 Project Goal Heating Index & Land Surface Variability - The WRF-based Differential Heating product combines information from surface vegetation, near surface soilmoisture, and time-integrated insolation to generate a proxy forsensible heating (i.e., a "Sensible Heat Index"). Verification – Simulated radar reflectivity values exceeding 35 dBZ at 4-km AGL are used to define CI “truth” locations. To aid in the analysis, back-trajectories from each CI location using the NAM have been created to identify where the cloud air parcels originated. To combine information from GOES-R with other data sources to improve forecasts of Convective Initiation (CI) 1-6 hours prior to initiation. These ancillary data include radar, model forecasts, and surface mesoanalyses. This Data Fusion Technique will result in an automated system that objectively combines the various data inputs and outputs a map of Probability of CI for the 1-6 hour forecast. Beginning in May, we will collect data for our candidate predictors in real-time from daily forecasts of the 4-km NSSL WRF-ARW model, as well as the model “truth” CI locations. At the end of the summer, this data will be analyzed using a statistical technique known as logistic regression; each predictor is assigned a weight and the output field is probability of a yes/no event, in this case CI. At that point, the statistical model can ingest data in real-time to make experimental CI probability forecasts. Accomplishments thus far The focus of the project up to now has been to identify a list of CI predictors and to test them on a case study from 21 May 2011. Below we will list the satellite and non-satellite predictors and show an example of each from the case study. GOES-R-based Predictors Split Window Difference – the 10.35-12.3 µm is corrected for temperature lapse rate, and temporal differences are calculated to identify regions with locally increasing values. This identifies regions of low-level moisture convergence, which often precedes convective cloud development. NWP and Mesoanalysis Predictors The possibilities are enormous for non-satellite predictors for CI. Here, we simply show a couple of model-based forecasts for where CI occurs, and some surface mesoanalysis fields that can be incorporated into the forecast. In practice, mesoanalyses from the SPC’s Surface Objectve Analysis can be used in real-time. 10.35 µm valid at 20 UTC Initial Feeback from potential users The two primary messages from NWS forecasters are 1) Predicting Convective Initiation is one (if not THE) biggest forecast problems remaining, and 2) Any GOES-R Product needs to be fused with information from other sources. These are the basis for the design of this project. During the upcoming 2012 Spring Experiment at the SPC, one of the desks of the Experimental Forecast Program will focus on Convective Initiation forecasts, so we will work with them further to refine the CI predictors Then we hope to have our prototype CI Probability Product tested as part of the GOES-R Proving Ground in the 2013 Spring Experiment. Simulated Atmospheric Motion Vectors (AMVs) and Radar Winds - Simulated AMVs are combined with clear-sky radar winds to modify a first guess of low-level convergence. Year 3 Funding With year 3 funding, we will be able to complete the evaluation of the prototype product at the SPC’s 2013 Spring Experiment, make changes to the product based on forecaster feedback, then start planning the CI Probability Product using actual GOES-R data after launch.