Download
1 / 20
200 likes | 337 Views
Station 5 / LED Analysis. LED Calibration: Calibration application Results Bad channels (low fitted number of PE) Comments Station 5 Analysis: Hits above 5 PE Expected pattern Results Conclusions. Calibration Application. New features:

E N D
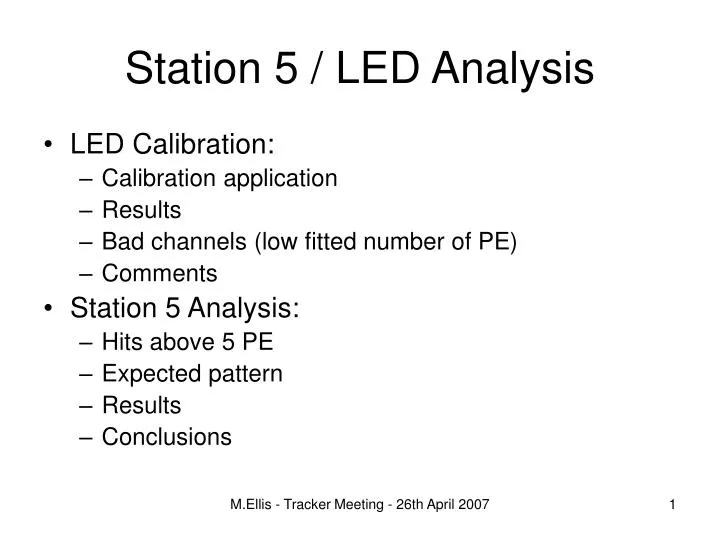
Station 5 / LED Analysis • LED Calibration: • Calibration application • Results • Bad channels (low fitted number of PE) • Comments • Station 5 Analysis: • Hits above 5 PE • Expected pattern • Results • Conclusions M.Ellis - Tracker Meeting - 26th April 2007
Calibration Application • New features: • Able to process a sub set of channels (listed in a text file) • Can produce a GIF of each fit (still having trouble with ps files in ROOT...) • Found and fixed the causes of the 60 or so channels which were getting a bad fit (see last meeting). • Now on both runs, all 1024 channels have a good fit (0 errors out of 4096 fits). • Will get a better test when I revisit the bias voltage optimisation scans for cassettes 105 and 112 later on (total of ~ 168k fits!) • Just in time for characterisation of cassettes in first production cryostat. M.Ellis - Tracker Meeting - 26th April 2007
Cassette 105 • Two runs of LED data analysed. • “Run 2” – taken in March immediately before the best set of self triggered cosmic ray data was recorded. • “Run 3” – taken two days ago when I returned to Fermilab. • Both used identical AFE boards and identical bias and cryo settings. • Following plots compare results, Run 2 is on the left, Run 3 is on the right. M.Ellis - Tracker Meeting - 26th April 2007
Detail of Fits • Each channel has two fits done (LED on and LED off). • The individual plots (one per channel) for the two LED runs as well as the root files used to make them can be found on the web: • http://www.mice.iit.edu/scratch/Calibration/ • Summary plots follow... M.Ellis - Tracker Meeting - 26th April 2007
Chi2 per DOF of the Fit M.Ellis - Tracker Meeting - 26th April 2007
Fitted Gains M.Ellis - Tracker Meeting - 26th April 2007
Fitted number of PE M.Ellis - Tracker Meeting - 26th April 2007
Channels < 1.5 PE (LHB) M.Ellis - Tracker Meeting - 26th April 2007
Channels < 1.5 PE (RHB) M.Ellis - Tracker Meeting - 26th April 2007
Channels < 0.5 PE (LHB) M.Ellis - Tracker Meeting - 26th April 2007
Channels < 0.5 PE (RHB) M.Ellis - Tracker Meeting - 26th April 2007
Bad Channels LHB Chan D0 Connector RHB: 29 64 30 63 31 62 32 61 33 69 34 70 35 72 36 71 LHB: 29 65 30 66 31 67 32 68 33 60 34 59 35 57 36 58 RHB M.Ellis - Tracker Meeting - 26th April 2007
Comments on LED Fits • Difference between the runs suggests that some of the low channels may be due to either differences in the holes in the spacer blocks used for the LED calibration, or possibly due to dust/grease/etc on the connector? • Don’t understand yet why most of the low light yield channels are clustered in the region between channel 29 and 36. • Overall, more recent LED data appears to be better, so calibration file from this run is used for Station 5 analysis. M.Ellis - Tracker Meeting - 26th April 2007
Station 5 Analysis • Same data as last time (in this case, only run 88) • Using the new calibration. • Currently looking at the number of hits on each channel (no decoding, so does not depend on that). • Count number of hits above 5 PE on an individual channel (no clustering, CMN subtraction, etc) • Would expect to see 5 MCMs with lots of hits above 5 PE and 3 MCMs on each board with few (ideally should be none!) M.Ellis - Tracker Meeting - 26th April 2007
Hits above 5 PE M.Ellis - Tracker Meeting - 26th April 2007
Expected MCMs • The waveguides were connected to modules 1, 3, 4, 6 and 7. • So we expect to see hits on the LHB on MCMs 1, 3, 4, 6, and 7 and on the RHB on MCMs 2, 3, 5, 6 and 8 M.Ellis - Tracker Meeting - 26th April 2007
Hits above 5 PE 2 3 5 6 8 1 3 4 6 7 M.Ellis - Tracker Meeting - 26th April 2007
Further investigation • Notice that the RHB appears to have more hits above 5 PE than the LHB. • Tried running on a smaller sample of this run (1000 events). • Results still look weird, but different... M.Ellis - Tracker Meeting - 26th April 2007
Hits above 5 PE 2 3 5 6 8 1 3 4 6 7 M.Ellis - Tracker Meeting - 26th April 2007
Conclusions • Calibration routine is now working with very high efficiency. • Still do not understand a few channels on each MCM that appear to have very low light yield in LED data. • Distributions of hits above 5 PE in self triggered cosmic ray data do not make any sense – shape is not mirrored on RHB wrt LHB and MCMs that should not see any light see a lot of hits above 5 PE. • With a subset of the data, LHB distributions look reasonable, but way too many hits on the RHB. • Something happens with more data (later into run) – perhaps a problem in the DAQ? • Further analysis of this is going to have to wait until after the prototype cryostat is shipped to Imperial. M.Ellis - Tracker Meeting - 26th April 2007