Download
1 / 31
340 likes | 548 Views
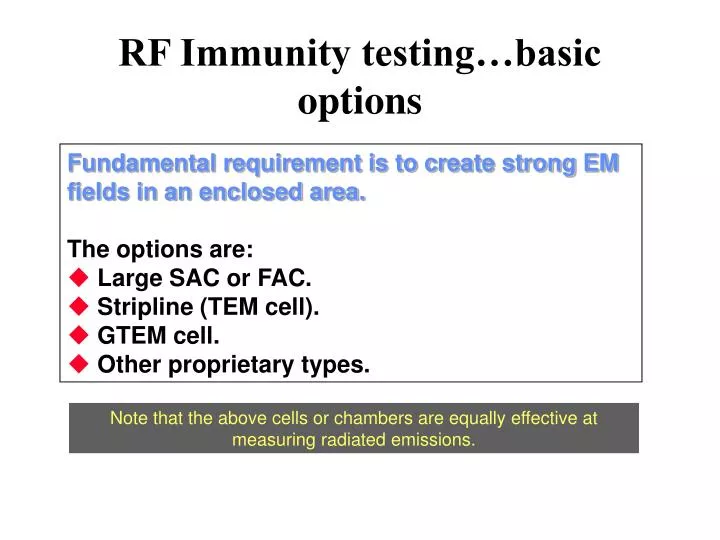
RF Immunity testing…basic options. Fundamental requirement is to create strong EM fields in an enclosed area. The options are: Large SAC or FAC. Stripline (TEM cell). GTEM cell. Other proprietary types.

E N D
RF Immunity testing…basic options • Fundamental requirement is to create strong EM fields in an enclosed area. • The options are: • Large SAC or FAC. • Stripline (TEM cell). • GTEM cell. • Other proprietary types. Note that the above cells or chambers are equally effective at measuring radiated emissions.
SAC – Semi-anechoic chamberRF immunity power requirements VERY inefficient design, most power is absorbed by the absorber. Needs large power amps to create required field strengths RF power amplifier Signal generator EUT
Stirred mode chamberRF immunity power requirements Unlined screened room, fitted with irregular ‘paddle wheels’ designed to change room resonances as they rotate. Only effective above 300MHz, but capable of creating high field strengths for moderate power input. RF power amplifier Signal generator EUT
To RF power amplifier EUT Terminating network TEM cell • Simple and efficient, needs low power for required field strengths. • Can only be used in a screened room • Limited to small sizes • Limited upper frequency • 15 x 15 x 5 cell: 500MHz • 30 x 30 x 10 cell: 200MHz Stripline Cell and Transverse Electromagnetic Mode Cell
GTEM cell Gigahertz TEM cell Avoids limitations of TEM cell by taking the co-axial input feed and gradually expanding the section. Absorber on end wall prevents reflections. Co-axial core feeds septum plate which is offset to increase EUT volume. Very efficient. Needs low power input for required field strength. No power is absorbed until wavefront passes EUT and reaches end face. RF absorbing end face Septum plate EUT
ARCell (Modified MAC cell) • Evolutionary design – Creates partial FAC inside cell • Field uniformity achieved by using absorber to limit reflections. • Generally limited accuracy. • Absorber reduces RF input efficiency, more power required to generate necessary field strength. RF absorbing end face EUT Transmitting antenna Partially lined with RF Absorber on all internal faces
LaplaCell • Evolutionary design – performance to match the GTEM • Field uniformity achieved with unique dual septum design • Balanced septum configuration… offers maximum EUT volume for given chamber size. • RF Efficiency high, same as GTEM. EUT Volume (Polypropylene Lining) Access door
RF power amplifier requirements Plot shows characteristics at 125MHz. This is a low point on the efficiency curve, therefore this plot represents the worst case situation. Other frequencies require less power for a given field strength
Ancillaries.. For emissions and immunity up to 20V/m • Compact • Very easy to use • All pre-calibrated with the cell • All USB interface • Just plug-and-play 3GHz Emissions analyser 3GHz Synthesiser 1GHz power amp. LETIS (auto switch unit) 3GHz power amp.
Key features • Best EUT size vs overall size characteristics. • Delivered fully ready for use. • Pre-calibrated for both emissions and immunity. No on-site assembly or commissioning required RF absorbing end face (Ferrite tiles) EUT Volume (Polypropylene Lining) Control and Monitoring compartment Access door
Key features • Full height door provides great accessibility to EUT volume. Full height access EUT Volume (Polypropylene Lining) Control and Monitoring compartment Access door
Key features Balun for Balancing and Impedance matching Impedance matching terminations Dual septum EUT Volume (Polypropylene Lining) Control and Monitoring compartment
Key features Note that the balun both balances the septums and acts to convert the 50ohm Input impedance to over 200 ohms characteristic impedance inside the cell. This provides a far better match to the free space impedance of 377 ohm than obtained by the 50 ohm characteristic impedance of the GTEM cell. Impedance matching terminations Dual septum EUT Volume (Polypropylene Lining) Control and Monitoring compartment
Key features This matters because the ideal test cell would emulate the ‘real world’ as closely as possible, so the impedance inside the cell should match ‘free space’ impedance as closely as possible. This match is far better achieved with the LaplaCell design. It means that the relationship between magnetic field and electric field in the EM emissions is more accurately determined. Impedance matching terminations Dual septum EUT Volume (Polypropylene Lining) Control and Monitoring compartment
Key features End detail showing absorber and access door. RF absorbing end face (Ferrite tiles), prevents internal reflections Impedance matching terminations Dual septum Balun for Balancing and Impedance matching EUT Volume (Polypropylene Lining) Control and Monitoring compartment Access door
Key features Arrangement of I/O filtered feeds. Feeds can be installed to suit individual customer requirements RF absorbing end face (Ferrite tiles), prevents internal reflections Cabling to EUT Dual septum Balun for Balancing and Impedance matching Access door EUT Volume (Polypropylene Lining) Filter section Control and Monitoring compartment Cabling to Ancillary equipment
Filter section Inner connection compartment External connection panel
Key features Sketch to show how the LaplaCell design gives a significantly more uniform field than conventional GTEM cells. The views below show the obvious fact that the field in the GTEM is more dense at the top than at the bottom of the EUT volume, therefore resulting in a less uniform field EUT volume LaplaCell fields GTEM fields
Cell calibration A VERY IMPORTANT TOPIC
Cell calibration A VERY IMPORTANT TOPIC • LaplaCells are calibrated for emissions and immunity to 3GHz • They are calibrated by measurement (not by any theoretical calculation) • They have a volumetric calibration measured over 27 points in the EUT volume. • They are calibrated for every 4MHz step from 30MHz upwards… (Actually every 2MHz for emissions from 30MHz – 1000MHz) • This calibration process is extremely detailed and is accomplished using computer processing and takes 2 days. No other cell undergoes anything like this. • The result is a calibration characteristic that is both highly detailed and dependable.
Cell calibration A VERY IMPORTANT TOPIC • For emissions calibration, an ERS (Emissions Reference Source), is placed inside the cell in locations to cover the whole EUT volume. • At each location a scan is measured. • If all these results are plotted… we obtain….
Cell calibration A VERY IMPORTANT TOPIC • For emissions calibration, an ERS (Emissions Reference Source), is placed inside the cell in locations to cover the whole EUT volume. • At each location a scan is measured. • If all these results are plotted… we obtain…. Note how most results form a tight group. At higher frequencies, odd results (corresponding to an odd location in the cell), ‘drop out’. This effect is acknowledged in IEC61000-4-20. At each frequency, the lowest 25% of values are discarded and the rest are averaged. This result is then compared with the known ERS result on a perfect 3m site
ERS calibration data This plot is what we would obtain if the cell acted as a perfect OATS. The Antenna Factor for the cell is therefore the difference between this and the actual results obtained in the cell
This plot shows the calculated correction data using the averaged values (thick black line). The Red line is using only the highest values (hence lowest correction). Note how close this Is to the black line… denoting good consistency). The blue line is worst case, using the lowest values (hence highest correction). In practice These values are never used due to multiple scanning techniques
This shows worst case deviations from true readings calculated from previous plots. Note that we can read up to 4dB high, or 10dB low if we happen to be in just the ‘wrong’ location at each frequency. In order to avoid these ‘drop out’ points, standard practice in cells is to scan 3 or 4 times with the EUT/cabling in different positions for each scan, and ‘max hold’ the results.
This shows the statistical error distribution of 3 different groups of scans, each with 4 locations selected at random. Note how these distributions compare well with accredited test lab performance. Also note that these results all correspond to near point sources. Larger EUTs and cables will degrade the accuracy significantly. This affects all cells, and to a lesser extent, chambers and OATS too.
System operation Immunity…. The software is pre-loaded with the cell calibration files and the field strength feedback signal is automatically fed back from the cell via the cell control cable. The Synthesiser is the core of the system. It interfaces the system to the PC, generates the RF signal and controls the signal level as required by monitoring the feedback signal from the cell. Once the Synthesiser is connected to the PC and all other connections to the power amps, LETIS and cell are made…. Basic operation is very simple. Frequency start, frequency end, stress level (V/m), frequency step (%) and dwell time are entered in appropriate fields… and click RUN. If the alternative strategy of setting the field with an empty cell first is required, just click PRE SCAN. Subsequent clicking of RUN will automatically use the pre-scanned settings. During any scan, the actual field levels are plotted in real time, as is the target field level. Modulation can be selected from a list (off, 1KHz am or pulsed modulation 200, 20 2Hz). An EUT prompt signal is available which can pulse each time a dwell period starts. An EUT monitor input is available, the status of which is plotted on screen. All results and setup data can be saved to file using standard Windows pull down menus and the file format is such that Excel (and other applications) will read the files directly.
System operation Emissions As with the immunity system, the emissions software is pre-loaded with the antenna factor for the cell. Obviously, because the cell is fully screened, there is no ambient noise to contend with. These factors make emission measurements extremely quick and straightforward. The software is also pre-loaded with the common emission limits for FCC, EU and Aus/NZ standards, so a direct assessment of compliance can be made. The PC software always defaults to the standard analyser settings such as scan rate, RBW (resolution bandwidth) and detector characteristics. So there is little room for errors! In accordance with standard practice for cells, the software can run in Max Hold mode whilst several scans of the EUT are made in various positions/orientations. Because the cell is calibrated with a traceable source, the measurements are directly related to OATS results. Measurement uncertainty is dependant on the type/size of EUT and the presence of cabling. For compact EUTs without cables, a measurement uncertainty of 6dB (same as normally offered by accredited test labs) is recommended. For less benign EUTs, the uncertainty should be increased. The increase depends on the above factors, and will be subject to the rigour with which the test is performed.
Background • Laplace Instruments Ltd have been a significant supplier to the EMC test industry for the past 14 years. • The first cells were delivered in year 2000. • These LaplaCells were originally developed for test lab use with inputs from NPL (London), Manchester University and PERA (Production Engineering Research Association). • They were the first cells to be compliant with IEC61000-4-20 (due to the collaboration with NPL, who originated the calibration techniques that were adopted for the standard). • There are now 46 Lc300 cells and 27 Lc600 cells in service with customers worldwide. • Customers include: • Rolls Royce (Aero Engines), UK • Siemens Instrumentation, UK • ABB Motor Drives, Finland. • Samsung, USA • Thales Navigation, France • Dundee University (Space satellite systems), UK • MTL (Instrinsically safe instrumentation), India • Sauter (Industrial instrumentation), Switzerland • Unitech (Test Lab), Indonesia