Download
1 / 41
410 likes | 445 Views
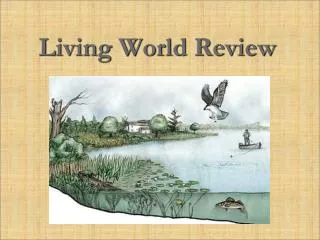
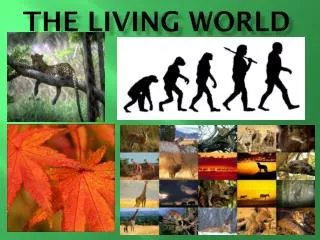
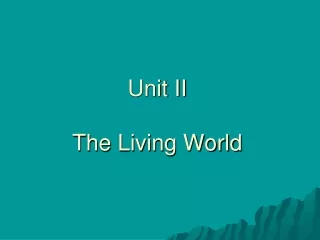
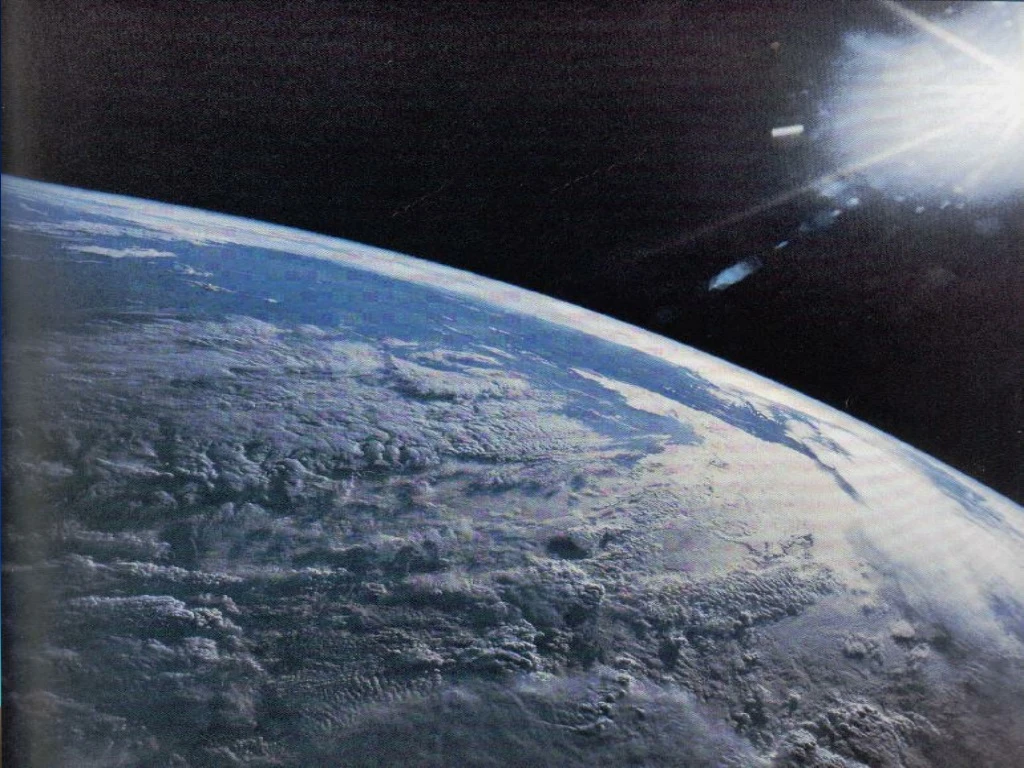
Living World. Biosphere : thin layer of the living world that surrounds the nonliving world. air organisms soil water. Biomes. Major communities of organisms occurring together at relatively large scales, such as at the landscape-level.

E N D
Living World • Biosphere: thin layer of the living world that surrounds the nonliving world. • air organisms • soil water
Biomes • Major communities of organisms occurring together at relatively large scales, such as at the landscape-level. • Tundra Taiga (conifers) • Deciduous Forest Chaparral (scrub) • Grassland Desert • Tropical Rainforest
Why do Biomes Differ? • Great differences in climate of earth • Living organisms require specific ranges in season, temperature, sunlight, rainfall and require interactions with other specific organisms • Each major type of climate develops a characteristic type of vegetation • Each type of plant life supports a characteristic variety of animal life.
Why do Biomes Differ? • Great differences in climate of earth • Living organisms require specific ranges in season, temperature, sunlight, rainfall and require interactions with other specific organisms • Each major type of climate develops a characteristic type of vegetation • Each type of plant life supports a characteristic variety of animal life.
T http://en.wikipedia.org/wiki/File:Vegetation-no-legend.pt.JPG
Do biomes affect the size of populations?Think about this as we discuss what a population is.
Populations A population is a group of organisms of the same species that live and interact in the same place at the same time. A population is made up of individuals of the same species that interbreed.
Four Rates Determine Population Size Population numbers change due to: Mortality: death rate Natality: birth rate Immigration: movement of new individuals into the population Emigration: movement of current individuals outside the population
Size of a Population Size of any population is the result of the relationships among these rates. Which factors most influence the trend of : Humans Mule Deer Red Wolves WHY????
Population Rate Changes What do mortality and emigration have in common? What do natality and immigration have in common? What must an organism be able to do to immigrate or emigrate? How does a plant incapable of movement establish a new population?
Passive Dispersal Used by organisms incapable of movement Animal Wind Water
In the same way that the web of life connects individuals, it also connects populations.
The Environment Two Components: Biotic: all living parts Plants, Animals Abiotic: all nonliving parts Soil, space Sunlight, water, wind
Population Numbers Limited The environmentlimits a population’s size Environment may slow, kill or enhance an individual’s growth/life and hence affect the size of the population.
Limiting Factor Any biotic or abiotic factor that can affect (+/-) the growth of a population. Temperature Moisture Amount of Sunlight Food Resources…
Author’s own picture Tucson, AZ T a
Limiting Factors Limiting factors may be measured alone, however each factor affects the other, and together, they affect population size. The effect may be either direct or indirect.
Water Water is an important abiotic factor. All organisms need water. Almost all chemical reactions needed to keep an organism alive take place in water. Water molecules are a part of many chemical reactions.
Limiting Factors Consider water. Do all organisms have the same needs? Evaluate the next 2 pictures and discuss their water needs. Is this limiting factor the same for both plant species?
Saguaro Cactus Author’s Picture Tucson, AZ
Columbine Author’s Picture Mt. Lemmon, Altitude for conifer forests Tucson, AZ
Populations and Limiting Factors Limiting factors affect the density (number) of the population. Under optimum conditions, the population will be favored and be able to reach maximum numbers. Must limiting factors have a negative connotation?
Optimum Range Range of ToleranceOptimum Range Zone of Stress Zone of Stress Death Death Population Density Limiting Factor Water, Temp., Sunlight…
Tolerance Graph Why is this always a bell-shaped curve? Which variable changes? Explain how rainfall amounts differ in need for deciduous forests and cacti.
Why did bluebirds and wood ducks suffer population declines?? What was their environmental limiting factor?? How did humans rescue these two species??
Space as a Limiting Factor Organisms require different amounts of space (abiotic factor). Space needs relate to a biotic factor – the availability of food energy. Why do space needs differ for plants and large meat-eating predators???
Limits to Population Size - Biotic Predators Disease Competition Environmental Stress (temperature…)
Carrying Capacity The greatest number of individuals that a space can support indefinitely without degrading the environment
Growth Curves Sigmoid (S-shaped) Boom and Bust
Levels off Slow down exponential colonization
Growth of a Population1) Sigmoid (S-shaped) Curve Once carrying capacity is reached # deaths should = # births Environmental resistance builds up in form of 1. disease 2.famine 3. predation Results in slowed rate of increase Population reaches equilibrium Most common
Growth of a Population2) Exponential Growth (Boom and Bust) #s increase exponentially (doubling) Exceeds carrying capacity CRASH (resources exhausted)
Boom and Bust Exponential curves typical for: Insect plagues Lemming populations Blooms of algae Rodents
Exponential Patterns Single Housefly Lays ~120 eggs Half are female Each female capable of 7 generations/yr 6,182,442,727,320 flies in one year!!!
Carrying Capacity Most important measure in determining population size. WHY??? Represents the ability of abiotic and biotic factors in the environment to provide necessary resources
How do humans affect the carrying capacity of ecosystems????
Global Stability Threatened by: Direct Harvesting Pollution Atmospheric Changes Habitat Loss
Litter Decomposition Rates LitterDecomposition Rates (Refuse Industry Production, Inc., Garbage in America – The Choice is Yours)