Download
1 / 27
270 likes | 279 Views
NURS/HSCI 597 Frequency Distribution. Heibatollah Baghi, and Mastee Badii. Levels of Measurement. Nominal-Level data is merely descriptive (e.g. religion, country name, region). Any assigned numerical value is merely for convenience (e.g. Christian = 1, Jewish = 2, Buddhist = 3)

E N D
NURS/HSCI 597Frequency Distribution Heibatollah Baghi, and Mastee Badii
Levels of Measurement • Nominal-Level data is merely descriptive (e.g. religion, country name, region). Any assigned numerical value is merely for convenience (e.g. Christian = 1, Jewish = 2, Buddhist = 3) • Ordinal-Level data has rank order, though intervals between data points cannot be considered equal (e.g. high/medium/low income, GDP/capita rank, HDI rank) • Interval-Level data has equal intervals between data points • Ratio-Level data has equal intervals between data points and a true zero
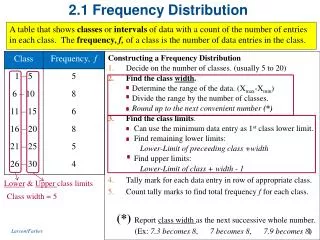
Ungrouped Frequency Distribution of Heart Rates • Sort the data • Tally the data (mutually exclusive and collectively exhaustive) • Sum the tally (Sum of frequencies = sample size)
Frequency Percentages & Cumulative Percentages • % = (f / N) * 100 • Percentage = First divide frequency by sample size and then multiply by 100 • Cumulative percentage shows the percentage of scores that are equal to or lesser than a specified score.
SPSS Steps for Frequency Distribution 1. Read data into SPSS 2. Select from Analyze 3. Select variable & press OK 3. Get results
Choose the Type of Chart that Best Describes a Variable Characteristic • Bar chart is used for Nominal or Ordinal data • Pie chart is an alternative to the bar chart • Histogram is appropriate for interval ratio • Polygon is equivalent to histogram but appear smoother
Bar Graph • Works for Nominal or Ordinal data • Consists of a horizontal (X-axis) and vertical dimension (Y-axis) • Categories are along the X-axis • Frequencies or percentages are displayed on Y-axis • SPSS can draw a bar graph for you
SPSS Steps: Recode for Bar Chart 2. Select variable 3. Rename 1. Selectto recode 4. Indicate changes 5.Show range 7. Heart raterecoded into 3 categories 6. Shownewvalues & add
SPSS Steps: Bar Chart 1. Follow steps for Frequency Distribution 2. Selectchart 3. Select bar chart 4. See results
Histograms(Grouped Frequency Distribution) • Used for interval or ratio level data • X-axis shows the categories, next to each other • Y-axis shows the frequency or relative frequency • Histograms are grouped-data frequency distributions
Histogram for Student Grades • Find the lowest and highest score • Find the range of scores • Decide on the number of intervals (e.g., 5) • Divide the range by number of intervals • Determine the lowest class interval • List all class intervals. • Tally the number of scores that fall in each class interval. • Convert each tally to a frequency.
Histogram of Student Grades • The lowest score and highest score (51,99) • The range of scores (99 – 51 = 48) • Number of intervals (5) • Range (48 / 5 ~ 10) • Lowest class interval (51-60) • All class intervals 51-60,61-70,71-80,81-90,91-100 • Tally the number of cases that fall within each interval • Frequency counts: 2,9,14,21,4
SPSS Steps: Histogram 1. Follow steps for Frequency Distribution 2. Selectchart 3. Select histogram 4. See results
Characteristics of Frequency Distributions • Central Tendency • Mean • Median • Variability • Range • Standard deviation • Shape (Normal, Bimodal, Skewed, J-Shaped, Kurtosis)
Take Home Lesson Data can be described by the central tendency, variability and shape of the frequency distribution