Download
1 / 8
80 likes | 553 Views
Frequency Distribution and Variation. Prepared by E.G. Gascon. Frequency Distributions. Frequency distribution: Quantitative Data is a table that shows classes or intervals (frequency f of a class is the number of data entries in the class

E N D
Frequency Distribution and Variation Prepared by E.G. Gascon
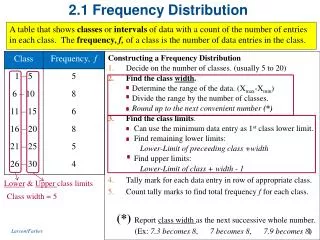
Frequency Distributions • Frequency distribution: Quantitative Data is a table that shows classes or intervals (frequency f of a class is the number of data entries in the class • Lower class limit = least number that can belong to the class • Upper class limit = greatest number that can belong to the class • Class width = distance between lower (or upper) limits of consecutive classes. (Not- lower-upper within a class) • Range – difference between the maximum and minimum data • Class boundaries- are the numbers that separate classes without forming gaps between them
Constructing a Frequency Distribution • Decide on the number of classes (could be arbitrary) • Find the range= highest value – lowest value • Find the class width = Divide the range by number of classes (round up to next whole number if decimal) • Decide the class limits • Tally • Count tally to find frequency • Total frequency
Creating a Histogram in Excel There are several ways depending upon the version Household Income Example • Enter the data (Midpoint as text by writing each with a ‘ in front ex: ‘250 • Select the Select the data and create a column
Creating a Histogram in Excel-p2 • Make the bars touch by changing the “gap width= 0” Right click on the bars and select “Format Data Series”
Measures of Central Tendency • Mean: sum of the data divided by number of entries • Affected by outliers (values which are a distance from the majority of entries • Median: Middle of data when the data set is ordered. • If the data set has an odd number of entries median is the middle data entry. • If the data set is even number of entries, the median is the mean of the two middle entries. • Mode: is the data entry that occurs with the greatest frequency. • If no entry is repeated, the data set has no mode. • If two entries occur with the same greatest frequency, each entry is a mode and the data set is called bimodal. • The mode is the only measure of that is used to describe data non-numeric data, when working with quantitative data, it is rarely used.
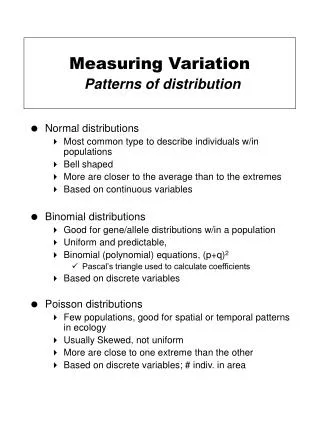
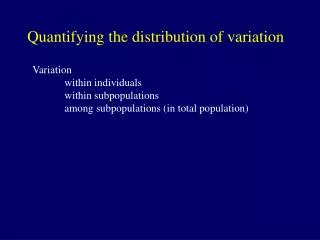
Measures of Variation • Range: is the difference between the maximum and minimum data entries in the set. • Deviation: of an entry x, in a population data set is the difference between the entry and the mean of the data set • Variance is the average of the sums of all the deviations. (not easily calculated in a large sample so…. Population variance: • Sample variance: • Sample Standard Deviation:
Interpretation of the Standard Deviation • The size of the standard deviation tells up something about how spread out the data are from the mean. • ~68% of the data lie within 1 standard deviation of the mean (1 times the size of the SD on either side of the mean) • ~95% of the data lie within 2 standard deviation of the mean(2 times the size of the SD on either side of the mean) ~99.7% of the data lie within 3 standard deviation of the mean(3 times the size of the SD on either side of the mean) Standard Score, (z-score) represents the number of standard deviations a given value x falls from the mean .