Download
1 / 14
260 likes | 756 Views
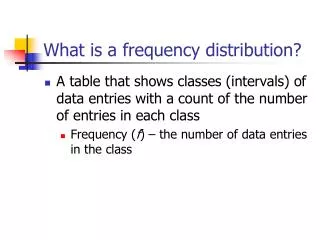
Frequency Distribution. Dhon G. Dungca. Frequency Distribution. The organization or arrangement of raw data in table form showing its classes and frequencies. Raw or Ungrouped Data Data collected in original form. Frequency The number of times a certain value or class of values occurs.

E N D
Frequency Distribution Dhon G. Dungca
Frequency Distribution • The organization or arrangement of raw data in table form showing its classes and frequencies. • Raw or Ungrouped Data • Data collected in original form. • Frequency • The number of times a certain value or class of values occurs.
Components of a Frequency Distribution • Class Limits • The end numbers of a class. It is the highest and the lowest values that can go into each class. • Class Boundaries • Are the “true” class limits defined by lower and upper boundaries. The lower boundaries can be determined by getting the average of the upper limit of a class and the lower limit of the next class. • Class Interval (I) • It is simply the length of the class. It is the difference or distance of the upper and lower class limits.
Components of a Frequency Distribution • Class Size (C) • The difference between the upper and lower boundaries of any class. It is not the difference between the upper and lower limits of the same class. • Class Mark (x) • Also known as the class midpoint. It is found by adding the upper and lower limits and dividing by two. It can also be found by adding the upper and lower boundaries and dividing by two. • Cumulative Frequency (F) • The number of values less than the upper class boundary for the current class. This is a running total of the frequencies. • Relative Frequency • The frequency divided by the total frequency. This gives the percent of values falling in that class.
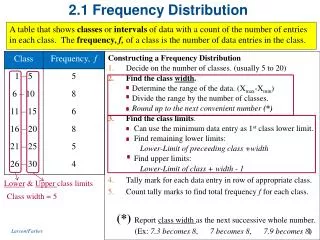
Constructing a Frequency Distribution • Array the given raw data in ascending order. • Find the largest and smallest values. Compute the Range = Maximum - Minimum • Compute for the tentative number of classes (K). The ideal number of classes is between 5 and 15. Or you may use the Sturges Method: K = 1 + 3.33 log n Where: K = tentative number of classes n = total number of observations log = common logarithm (base 10)
Constructing a Frequency Distribution • Compute for the Class Interval (I) by dividing the range by the tentative number of classes (K). Use class interval rounded to the nearest whole number. • Sort the arrayed data into appropriate classes using convenient and easy to read class limits. Start the first class with a lower limit either equal to or a little bit less than the lowest observed value. • Set up the class boundaries if necessary. • Determine the class mark or midpoint. • Count or tally the number of observations into the appropriate class intervals. • If necessary, find the relative frequencies and/or relative cumulative frequencies.
Example 1 • The following are the scores obtained by 35 students in a quiz in statistics: • Construct a frequency distribution showing the class limits, class boundaries, the class mark, the relative frequency and the cumulative frequency if K = 7.
Graphical Representation of the Frequency Distribution • Histogram • A graph which displays the data by using vertical bars of various heights to represent frequencies. The horizontal axis are the class boundaries. • Frequency Polygon • A closed broken line curved constructed by plotting the class marks on the horizontal or x-axis against the class frequencies which are plotted on the vertical or y-axis. • Ogive (pronounced o-jive) • Is the graph of a cumulative frequency distribution. It is constructed by plotting the class boundaries on the horizontal against the cumulative frequencies plotted on the vertical axis.
Example 2 • The following data taken from the records of the personnel department of a bank in Makati are the scores obtained in an aptitude test given to 50 applicants: • Prepare a frequency distribution table showing the following: • The class limits, class boundaries and class marks. • The relative frequency and the cumulative frequencies. • Construct the frequency polygon for this distribution.