Download
1 / 40
400 likes | 537 Views
Multi-scale Modeling of the Effects of Global Change upon Regional Air Quality. Research Team. WSU : Jeremy Avise, Jack Chen, and Brian Lamb UW : Clifford Mass and Eric Salathe NCAR : Alex Guenther, Christine Wiedinmyer, and J. F. Lamarque

E N D
Multi-scale Modeling of the Effects of Global Change upon Regional Air Quality
Research Team • WSU: Jeremy Avise, Jack Chen, and Brian Lamb • UW: Clifford Mass and Eric Salathe • NCAR: Alex Guenther, Christine Wiedinmyer, and J. F. Lamarque • USDA – Forest Service: Don McKenzie and Sim Larkin • USDA – NRCS: Susan O’Neill • CSU – David Theobald
Global Change & Regional Air Quality • How will global change affect regional air quality in the future? • How will land use changes due to climate change affect air quality? • How are biogenic emissions affected by global climate change and land management practices? • How will changes in emissions in Asia impact U.S. air quality? • How will the role of fire change with respect to regional air quality in the future? • How will global change affect atmospheric deposition in sensitive ecosystems?
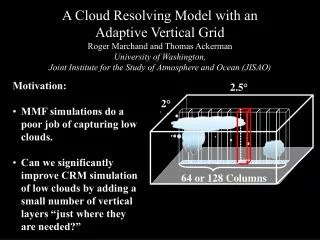
Global to Regional Scale Modeling • IPCC - A2 scenario“Business as usual” • Simulate two 10-year periods • Current 1990 – 1999 • Future 2045 – 2054 • Sensitivity Analyses • Emissions, meteorology & BC effects • Land management scenarios • Fire emissions
Emissions development and projection • Global emissions in MOZART2 are based on EDGAR3.2 estimates and include anthropogenic and natural emissions. • Future emissions consistent with IPCC A2 scenario • US emissions processed using SMOKE • EPA anthropogenic emissions (1999 NEI current decade, EPA EGAS future projections) • NCAR MEGAN biogenic emissions • Fire Emissions: • Current decade – fire history dataset + Bluesky emissions (Bureau of Land Management fire history dataset) • Future decade – Fire Scenario Builder stochastic model (FSB) • Land use change incorporates natural vegetation migration coupled with adjustments for urbanization (SERGOM) and expansion of agricultural lands in the US.
Current decade: comparison of observed and simulated ozone distributions: EPA-AIRs data EPA – AQS ozone data for 1994-2003 Summer
Average daily maximum 8 hr ozone and 99th percentile daily max 8 hr ozone Observations & simulations from 10 summers
Measured Model [ppbv] Current decade99th percentile daily max 8-Hr ozone
Observed and predicted distributions of daily max 8 hr ozone 99th, 80th, Average, 20th, 1st Percentile, 8-hr daily max ozone
Summer Daily Max 2-m Temperature Current vs Future (deg C) Current Future Difference
Future vs Current Conditions: July Temperatures Daily Average Maximum current change
Daily Average Maximum Meteorological Changes: July Mixed Layer Heights current change
Chemical Boundary Condition Changes west up to 500 mb north
anthropogenic July Emission Changes: NOX current change
biogenic July Emission Changes: VOC current change
Future changes in average daily max 8 hr ozone and 99th percentile 8 hr daily max ozone
Future changesAverage Daily Max 8-Hr Ozone [ppbv] Future Current Current Future Difference
Future ChangesDaily Max 8-Hr Ozone (Episodic Condition - 99th Percentile) [ppbv] Future Current Difference
Attribution Study: 5 current/future July’s • CUR current met current BC current US emissions • FUT future met future BC future US emissions • MET future met current BC current US emissions • BC current met future BC current US emissions • EMIS current met current BC future US emissions
FUT-CUR: +8.6 EMIS-CUR: +3.9 CUR: 80 ppbv BC-CUR: +6.2 MET-CUR: -0.2 Results: July 8-hr O3 98th percentile
Attribution results: July 8-hr O3 distributions 2nd percentile, 20th percentile, average, 80th percentile, 98th percentile
FUT: 6.1 EMIS: 3.6 CUR: 2.2 BC: 4.2 MET: 2.6 Results: July 8-hr O3 80 ppbv exceedances Average # exceedences / July / US grid
Seattle Portland 8-hr O3 95th percentile
FUT-CUR: +5.7 EMIS-CUR: +10.0 CUR: 20.7 μg m-3 BC-CUR: +0.1 MET-CUR: -2.9 Results: 1-hr PM2.5 95th percentile
FUT-CUR: 400% / 64% EMIS-CUR: 1117% / 163% CUR: 266 / 1107 BC-CUR: 3% / 0% MET-CUR: -83% / -71% Results: 24-hr PM2.5 35 μg/m3 exceedances
Land Management Scenario: Widespread Use of Tree Plantations July Isoprene Emission Capacity (30 oC) Future Current Future with Plantations
Increase in peak 8-hour average ozone associated with increasing tree plantations Increase in the days per July that the 8-hour average ozone exceeds 80 ppbv due to increasing tree plantations Changes in 8-hr ozone concentrations for enhanced tree plantations in the future
Summary • Comparison to current observations • PCM temperatures are biased low • 8 hr daily max O3 peak values are correctly captured, low end of the distribution is overestimated • Future changes: • Peak O3 increases of 5 to 15 ppbv • significant increases in occurrences above 80 ppbv • PM2.5 significant increases--5.7 ug/m3 above 20 ug/m3 currently • Large increase in number of PM2.5 exceedences of new 24 hr standard • Attribution Analyses: • future O3 changes mainly due to changes in chemical BC and US anthropogenic emissions • Changes in meteorology (climate) have a secondary effect on future ozone concentrations for the emission projections in this work • Landuse changes • Increases in BVOC emissions due to climate change are offset by reduction in forested areas • Enhanced use of tree plantations for C sequestration has significant impact on isoprene emissions and ozone concentrations for the future decade.
Ensemble modeling of global change and regional air quality: Next steps • develop a quantitative measure of the uncertainty in our modeling framework using ensemble modeling methods in comparison to current decade observations; • project these uncertainties into the future for the period 2045-2054 and quantitatively address the uncertainties that accompany projections of future emissions, both global and in the U.S., including changes in landcover and the effects of change on urbanization, biogenic emissions, and the role of fire in air quality; and • continue to address our overall research questions that will help determine the consequences of global change upon U.S. air quality.
Global/regional ensemble members: current decade uncertainty analyses
Atmospheric instability = CAPE Map Types= 500mb & 700mb ht. MM5 meteorology (from climate model) NFDRS (equations predict fuel moisture in fuel size classes that carry fire) Fire frequency/cycle (from potential natural vegetation) Management (not implemented here) Flammability Ignition Avail Based on historical fuel types Fire Generator X Fire Starts Fire Sizes Fire Scenario Builder
Simulated future fires Current decade fires Comparing PM2.5 emissions from current decade with simulated future fires
PCM comparison to observations: unrealistic wintertime cold outbreaks