Download
1 / 19
190 likes | 310 Views
Bootstrapping – using different methods to estimate statistical differences between model errors. Ulrich Damrath COSMO GM Rome 2011. Some typical situations occuring during operational verification :. ahhdfkfflflflflflfkfkfkjdjdddnbdnnnd. Questions:.

E N D
Bootstrapping – using different methods to estimate statistical differences between model errors Ulrich Damrath COSMO GM Rome 2011
Some typical situations occuring during operational verification: ahhdfkfflflflflflfkfkfkjdjdddnbdnnnd
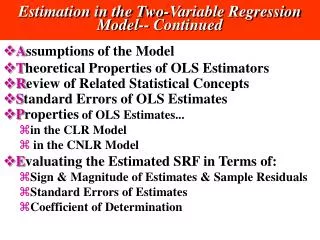
Questions: • 1.Question: Are the differences of scores due to noise or are they statistical significant? • 2. Question: Are there significant differences between the quality of different models? (Interests user of forecasts) • 3. Question: Are there significant differences between the quality of models for different situations? (Interests developers of models) • Problem: BIASes may be normal distributed, but RMSEs? • A possible solution: Application of bootstrap techniques to get confidence intervals or quantiles of the distribution • 1. Question concerning the bootstrap method: How many replications are necessary to get stable statistical results? • 2. Question concerning the bootstrap method: How should the sample data be grouped in order to avoid autocorrelation effect?
The principle of bootstrapping for a sample with 10 elements Realisation 1: mean value using elements: 5 3 8 7 8 4 7 0 4 3 Realisation 2: mean value using elements: 3 2 0 5 1 2 0 2 2 8 Realisation 3: mean value using elements: 5 2 3 6 8 3 8 0 8 6 Realisation 4: mean value using elements: 7 5 1 6 4 0 1 2 1 6 Realisation 5: mean value using elements: 6 5 8 6 1 0 0 2 3 2 Realisation 6: mean value using elements: 1 0 5 5 6 5 8 5 5 8 Realisation 7: mean value using elements: 3 4 4 4 2 8 5 3 2 6 Realisation 8: mean value using elements: 0 8 2 0 6 4 1 6 6 5 Realisation 9: mean value using elements: 0 7 5 6 3 2 2 3 8 8 Realisation 10: mean value using elements: 2 2 3 6 6 6 6 2 0 0 The mean value of all realisations (replications) gives the bootstrap mean. The standard deviation of all mean values gives the bootstrap standard deviation as
Bootstrap properties for three analytical cases Number of sample values: 31
Bootstrap properties for three analytical cases Number of sample values: 310
Bootstrap properties for three analytical cases Number of sample values: 3100
Bootstrap properties for three analytical cases Number of sample values: 31000
Bootstrap properties for three analytical cases Number of sample values: 310000
Conclusion concerning the convergence of the method: A number of ~500 replications seems to be appropriate to get a stable value for the bootstrap variance. Setting the sample characteristics: Treating each pair of observations and forecasts as a single sample member leeds to large sample sizes with relatively high autocorrelation. Therefore values are grouped by blocks of one, two and four days. Additionally, a block size was constructed using the optimal block length LOPTwhich can be estimated by with ‚a‘ as a function of autocorrelation and N as sample size.
The real world: Dependence of bootstrap standard deviation and bootstrap confidence intervals on the number of replications 2m-temperature forecasts during Summer 2010 and 10m-wind speed during Winter 2010/2011. BIASes for different periods, models and weather elements
The real world: Dependence of bootstrap standard deviation and bootstrap confidence intervals on the number of replications 2m-temperature forecasts during Summer 2010 and 10m-wind speed during Winter 2010/2011. RMSEs for different periods, weather elements and types of mean wind direction over Germany (700 hPa)
Quantiles 10% and 90% for different bootstrap types, Period 01.06.2010 – 31.08.2010 COSMO-EU (solid), COSMO-DE (dotted), Element Temperature 2m Top: Median and quantiles (green: overlapping quantiles, red: no overlapping quantiles) Bottom: another visualisation of the overlapping intervals (bluish: overlapping intervals, deep red: no overlapping intervals)
Quantiles 10% and 90% for different bootstrap types, Period 01.06.2010 – 31.08.2010 COSMO-EU (solid), COSMO-DE (dotted), Element Wind speed 10m Top: Median and quantiles (green: overlapping quantiles, red: no overlapping quantiles) Bottom: another visualisation of the overlapping intervals (bluish: overlapping intervals, deep red: no overlapping intervals)
Comparison of overlapping quantile intervals for different wind directions NW: north westerly flow, SW: south westerly flow, NO: north easterly flow, SO: south easterly flow
Comparison of overlapping quantile intervals for different wind directions NW: north westerly flow, SW: south westerly flow, NO: north easterly flow, SO: south easterly flow
Modification of turbulent mixing length May 2009: Some typical situations occuring during operational verification in 2009, 2010 and 2011:
Conclusions: • Different types of grouping the samples lead to different result concerning the statistical significance of the model errors. • Block methods give more or less equivalent results. • The results for the comparison of different models may users lead to a decision which model should be used. • The results for different weather types (flow directions) may developers give some hints concerning the development of model physics.
References: Efron, B., Tibshirani, R.J.(1993): An Introduction to the Bootstrap (Chapman & Hall/CRC Monographs on Statistics & Applied Probability) Mudelsee, M. (2010): Climate Time Series Analysis – Classical Statistical and Bootstrap Methods, Springer Dordrecht, Heidelberg, London, New York