Download
1 / 54
591 likes | 806 Views
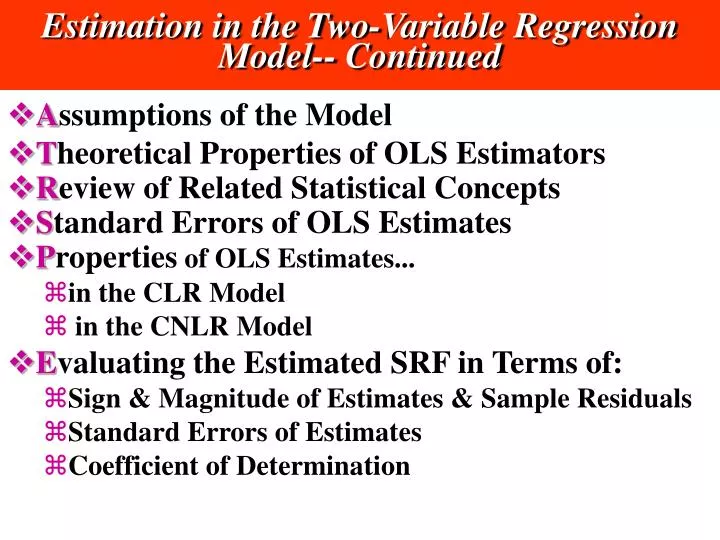
Estimation in the Two-Variable Regression Model-- Continued. A ssumptions of the Model T heoretical Properties of OLS Estimators R eview of Related Statistical Concepts S tandard Errors of OLS Estimates P roperties of OLS Estimates... in the CLR Model in the CNLR Model

E N D
Estimation in the Two-Variable Regression Model-- Continued • Assumptions of the Model • Theoretical Properties of OLS Estimators • Review of Related Statistical Concepts • Standard Errors of OLS Estimates • Properties of OLS Estimates... • in the CLR Model • in the CNLR Model • Evaluating the Estimated SRF in Terms of: • Sign & Magnitude of Estimates & Sample Residuals • Standard Errors of Estimates • Coefficient of Determination
Assumptions of the Regression Model • In regression analysis, we have two objectives: • Estimatingthe PRF and… • Drawing statistical inference about its parameters • We also want our estimates to be reliable and enjoy certain desirable statistical properties that would make hem robust estimates. • This requires us to make certain assumptions about the PRF and the error term,u.
Assumptions of the Regression Model • Linearity in Parameters and Error Term • Non-random Independent Variables • This means that we assume independent variables are fixedin repeated sampling. • Zero Mean Error • In small samples this assumption might not hold but as the sample size increases the mean error tends to zero. • As long as the regression model includes a constant (intercept) term, this assumption is automatically satisfied.
Assumptions of the Regression Model Constant or Homoscedastic Error Variance This requires all Y values to come from the same distribution, one with a zero mean and variance,². If this is violated (i.e., if the error variance is heteroscedastic) we lose precision when we estimate the regression parameters.
Assumptions of the Regression Model No Serial- or Auto-correlation This means that ui and uj (i j) in cross sectional data, or ut and ut-1 in time series data, are uncorrelated. In other words, given Xi , the error term does not follow a systematic pattern. We distinguish between positive and negative autocorrelation.
Assumptions of the Regression Model No Correlation BetweenXandu When we specify the PRF as a function of X and u, we assume that these two variables have separate and additive effects on Y. Nonzero Degrees of Freedom,n > k For each unknown parameter we estimate we need at least one degree of freedom. Nonzero Variance for Independent Variables
Assumptions of the Regression Model No Specification Error in the... choice of independent variables functional form of the regression equation probabilistic assumptions on u No Perfect Multicollinearity No Measurement Error in YiorXi The population error term,ui, follows the normal distribution 11 12
Rationale for the Normality Assumption • Earlier, we said in regression analysis we have dual objectives: Estimation and inferences. • As far as estimation is concerned, all we need to generate “good" estimates is assumptions 1-11. • But in order to draw statistical inference (i.e., test hypotheses,) we also need to make an assumption regarding the probability distribution of the population error term, ui.
Rationale for the Normality Assumption But why the normal distribution? Because it is the most general probability distribution. Which is established by Central Limit Theorem.
The CLR and CNLR Models Any regression model that satisfies assumptions 1-11 is known as a Classical Linear Regression (CLR) Model, which is suitable for estimation alone. • Any regression model that satisfies assumptions • 1-12 is known as the Classical Normal Linear Regression (CNLR) model, suitable not only for estimation but also for testing hypotheses.
Probability Distribution of the Error Term & the Dependent Variable in the CNLR Model Assumption 3 (zero mean error); assumption 4 (constant error variance); assumption 5 (no autocorrelation), assumption 12 (normality) imply that the ui are independently identically distributed (iid) normally with zero mean and finite variance, 2. ui ~ n(0, 2)
Probability Distribution of the Error Term & the Dependent Variable in the CNLR Model • Because Yi is a linear function of ui, it follows that Yi ~ n(1+2Xi, 2)
Probability Distribution of OLS Estimators ^ ^ ^ Recall that 1, 2, …, kare linear functions of Yi, which has a normal distribution in CNLR model. This along with the fact that these estimators are unbiased implies that ^ ^ 1 ~ n(1, Var(1)) ^ ^ 2 ~ n(2, Var(2)) ….……………… ….……………… ^ ^ k ~ n(k, Var(k))
Standard Errors of Estimates Note the difference between standard errorand standard deviation. The former is a population concept whereas the latter is a sample quantity.
Standard Errors of Estimates In the bivariate regression model, the true or population variances of the OLS estimators are: ^ _ Var(ß2) = [1/(Xi ‑ X)2]2 ^ _ Var(ß1) = [Xi2/n(Xi ‑ X)2]2 Where 2 is the true or population variance of ui (as well as Yi).
Standard Errors of Estimates ^ ^ Note the following features of Var(ß1) & Var( ß2): ^ Var(ß1) is directly proportional to the variance of the dependent variable (2) but is inversely proportional to the variance of X. ^ Because 2 is inversely related to the sample size, n, the variances of the slope and intercept terms are inversely related to the sample size.
Standard Errors of Estimates Variance of the intercept term is directly proportional to both the variance of Y and Xi2but is inversely proportional to the variance of Xi and the sample size, n. ^ ^ Note that because ß1 and ß2 are random, in any given sample they may be dependent on each other. This can be studied by looking at the covariance between the two ^ ^ _ ^ Cov(ß1, ß2) = -X[Var(ß2)]
The family of normal distributions include the t, Chi-square (2), and F Distributions. • Please review the properties of these distributions in Appendix 5A, pp. 159-161 of Gujarati. Some Useful Probability Distributions Related to the Normal Distribution
Theoretical Properties of OLSE • “There is an infinite number of estimators for estimating a parameter since there is an infinite number of ways in which a sample of data can be used to produce a linear estimate for an unknown parameter. • “Some of these are 'bad' estimators and some are 'good'. What distinguishes an econom-etrician is the ability to produce 'good' estimators, which in turn produce 'good' estimates.
Theoretical Properties of OLSE • “One of these 'good' estimators could be chosen as the 'best' estimator and used to generate the 'best' estimate of the parameter in question.” (Kennedy, P. 5)
Theoretical Properties of OLSE • In econometrics 'goodness' of estimators is measured in terms of certain desirable statistical properties. • Underlying theoretical properties of estimators is the notion that estimators are random variables and thus have sampling or probability distributions.
Review of Statistics • Desirable statistical properties of point estimators are divided into two groups: • small or finite sample properties • large sample or asymptotic properties • Small or finite sample properties include: • Unbiasedness • Minimum Variance • Efficiency • Minimum Mean-Square-Error (MSE)
Review of Statistics • Large sample properties include: • Asymptotic unbiasedness • Consistency
Small or Finite Sample Properties: Unbiasedness • ^ • An estimator, , is said to be an unbiased estimator of the population parameter if, in repeated sampling, its expected or mean value equals the true parameter, , • ^ • E( ) = • or^ ^ • Bias( ) = E( ) - = 0 • Note that unbiasedness is a property of repeated sampling, not of a single sample.
Small or Finite Sample Properties: Minimum Variance • ^ • An estimator, , is said to be a minimum estimator of if it has the smallest variance relative to all other estimators of . • Note that a minimum variance estimator may or may not be an unbiased estimator.
Small or Finite Sample Properties: Efficiency • ^ • An estimator, , is said to be an efficient estimator of if it is both unbiased and has minimum variance in the class of all unbiased estimators. • Thus efficiency is equivalent to minimum-variance unbiasedor best unbiased estimator (BUE).
Small or Finite Sample Properties: Best Linear Unbiased Estimator (BLUE) • ^ • An estimator, , is said to be the best linear unbiased estimator (BLUE)of the true population parameter, , if it is... • linear • unbiased • minimum variance in the class of all linear unbiased estimators of . • Thus BLUEis equivalent to linear and efficient. • Note that BLUE is a weaker property than BUE.
Small or Finite Sample Properties: Minimum Mean Square Error (MSE) • ^ • The MSE of an estimator, , is defined as follows, • ^ ^ ^ • MSE() = Var() + [Bias()]2 • The minimum MSE property recognizes the possible trade off between variance and bias.
Large Sample or Asymptotic Properties:Asymptotic Unbiasedness • ^ • An estimator, n , based on a sample of size n, is an asymptotically unbiased estimator of if, as n increases, the expected value of the estimator approaches the true parameter. • ^ • In other words, Bias( ) tends to zero as nincreases continually.
Large Sample or Asymptotic Properties:Consistency • An estimator is consistent for a true but unknown parameter if it approaches the true population parameter as the sample size, n, increases indefinitely. • In other words, in the limit, the distribution of a consistent estimator collapses to the single value, . • A sufficient (but not necessary) condition for consistency is that both bias and variance of the estimator tend to zero as n increase, that is that MSE tend to zero as n increases.
Properties of OLSE in the CLR Model: Gauss-Markov Theorem • In the CLR model, the OLS estimators are the "best" in the sense that they are unbiased and minimum variance (i.e., they are efficient) in the class of all linear unbiased estimators. • Thus, in the CLR model, the OLSE are BLUE. • Moreover, the OLSE are consistent.
Properties of OLSE in the CLR Model: Gauss-Markov Theorem • The unbiasedness and consistency properties follows from assumptions 3 and 6. • The efficiency property follows from assumptions 5 and 6.
Properties of OLSE in the CLNR Model: Rao Theorem In the CNLR model… 1. OLSE are BUE and consistent ^ 2.(n-k)2/2 ~ 2(n-k) ^ 3. ßs are distributed independently of 2
Introduction to Monte Carlo Experiments Having concluded our discussion of theoretical properties of OLS estimators in the CLR and CNLR models, it is natural to ask… Given that in practice we never observe the probability distribution of an estimator, how can we tell the OLS (or other) estimators have such desirable statistical properties as BLUE?
Introduction to Monte Carlo Experiments • There are two possible answers to this question: • 1. We can prove theoretically (mathematically) that a given estimator does or does not enjoy a certain statistical property. • 2.Another way of ascertaining the sampling distribution and other properties of an estimator is to make use of a methodology known as theMonte Carlomethod or experimentation.
Introduction to Monte Carlo Experiments • In this method, one simulates (i.e., imitates) the “repeated sampling” concept by obtaining very many point estimates of a parameter and using them to examine/establish various properties for the estimator in question. • Let’s see how this done in the context of a numerical example.
Monte Carlo Experiments • In this example, we experiment with samples of size 100, which we use to and carry out 50 experiments. • Step 1: Generate Data • a. Make up a PRF by making up values for its parameters, 1 and 2, e.g., • Yi = 15 + 1.5Xi + ui
Monte Carlo Experiments • Step 1: Generate Data-- Continued • b. Make up 50 sets of values for Xi (i= 1, 2, 100) which are to be kept fixed throughout the experiment. • c. Generate 50 sets of values for the population error term,ui, with each set containing 100 values. Do this using a normal distribution, random-number generator such that each set has zero mean and unit variance.
Monte Carlo Experiments • Step 1: Generate Data-- Continued • d. Generate 50 sets of Yi values using the PRF from step 1.a, the set of 50 values for Xi from step 1.b and the 50 sets of 100 values for ui from step1.c.
Monte Carlo Experiments • Step 2: Estimate the “made-up” PRF using the generated data • Step 1 yielded 50 samples of size 100 with the Yivalues varying from sample to sample but the Xi values being fixed in all samples. • Using OLS and each of the 50 samples of size 100, • estimate the two parameters of the made-up PRF. • This yields 50 values for each of two supposedly unknown population parameters, b1 and b2.
Monte Carlo Experiments • Step 3: Use the Estimates to Check the Desired Result • Use the fifty pairs of estimated values of the two unknown parameters from step 2 to check properties of the OLSE. • For example, check the unbiasedness property of the OLSE by finding the average of all 50 estimates of 2 to see if it is approximately equal to the value you made up for it in step 1, which is 1.5.
Introduction to Monte Carlo Experiments for the results of the above example see the table distributed in class
Evaluating the Estimated Model Once estimated, we must evaluate the sample regression function to see how well it fits the data. We do this in terms of… signs and magnitudes of estimated coefficients and residuals standard errors of OLS estimates coefficient of determination
Evaluating the Estimated Model: Signs and Magnitudes of Estimates We use economic theory to specify the PRF. Theory indicates not only what independent variable(s) to include in the model, often it also indicates what signs we should expect for the coefficients associated with these variables. If we estimate a regression equation and observe sign reversal, i.e., a sign that goes against a priori theoretical expectations, we should be alarmed. The sizes or magnitudes of the estimated coefficients are also important.
Evaluating the Estimated Model: Standard Errors of Estimates Point estimates are random variables as they change from sample to sample. Thus, we must assess their precision or reliability. In statistics, the precision of estimates is measured by their standard errors. All else the same, the smaller the standard error of a point estimate, the more precise that estimate.
Evaluating the Estimated Model: The Coefficient of Determination We need criteria for assessing the overall fit of the sample regression line. In practice, because of sampling fluctuation, it is impossible to obtain a perfect fit.
Coefficient of Determination In general, there will be some positive ûiand some negative ones. How good the sample regression line fits the sample data depends on how small the individual ûi are. The simple sample coefficient of determination,R2, is a measure that summarizes this information.
Coefficient of Determination We calculate R2 as follows. Recall that, ^ ^ Yi = Yi + ui Write this in deviation form, ^ ^ yi = yi + ui Square both sides and sum over all observations, ^^^ ^ ^ ^ y2 = y2 + u2 + 2yiui = y2 + ui2
Coefficient of Determination The above equality consists of three sums of squares, or variations: 1. y2 which represents total variation of actual Y values about their sample means. We call this total sum of squares (TSS) ^ 2.y2, which represents variation of estimated Yvalues about their sample mean, known as explained sum of squares (ESS)