Download
1 / 107
1.16k likes | 1.39k Views
Covariate Adjusted Functional Principal Component Analysis ( FPCA ) for Longitudinal Data. Ci-Ren Jiang & Jane-Ling Wang University of California, Davis National Taiwan University July 9, 2009. TexPoint fonts used in EMF.

E N D
Covariate Adjusted Functional Principal Component Analysis (FPCA) for Longitudinal Data Ci-Ren Jiang & Jane-Ling Wang University of California, Davis National Taiwan University July 9, 2009 TexPoint fonts used in EMF. Read the TexPoint manual before you delete this box.: AAAAAAAAAAAAAAAAAAAAAAAAAAAAAAAAAAAAAA
Outline • Introduction • (Univariate) Covariate adjusted FPCA ? (Multivariate ) Covariate adjusted FPCA • FPCA as a building block for Modeling • Application to PET data
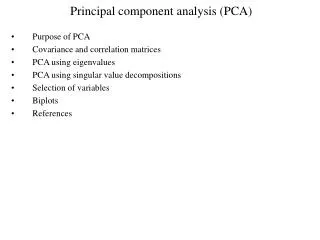
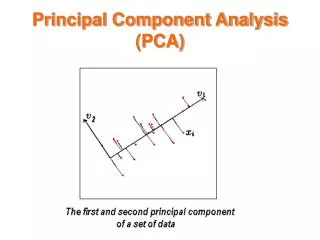
1. Introduction • Principal Component analysis is a standard dimension reduction tool for multivariate data. It has been extended to functional data and termed functional principal component analysis (FPCA). • Standard FPCA approaches treat functional data as if they are from a single population. • Our goal is to accommodate covariate information in the framework of FPCA for longitudinal data.
Functional vs. Longitudinal Data • A sample of curves, with one curve, X(t), per subject. - These curves are usually considered realizations of a stochastic process in . - dimensional • Functional Data - In reality, X(t) is recorded at a regular and dense time grid high-dimensional. • Longitudinal Data – irregularly sampled X(t). - often sparse, as in medical follow-up studies.
Longitudinal AIDS Data • CD4 counts of 369 patients were recorded. The number , of repeated measurements for subject i, varies with an average of6.44. • This resulted in longitudinal data of uneven no. of measurements at irregular time points.
Review of FPCA • Both longitudinal and functional data may be observed with noise (measurement errors). the observed data for subject i might be
Review of FPCA Functional Data Dauxois, Pousse & Romain (1982) Rice & Silverman (1991) Cardot (2000) Hall & Hosseini-Nasab (2006) Longitudinal Data Shi, Weiss & Taylor(1996) James, Sugar & Hastie(2000) Rice & Wu (2001) Yao, Müller & Wang (2005)
Steps to FPCA TexPoint fonts used in EMF. Read the TexPoint manual before you delete this box.: AAAAAAAAAAAAAA
Estimation of Mean Function Taipei 101
References • Yao, Müller and Wang (2005, JASA) Methods and theory for the mean and covariance functions. • Hall, Müller and Wang (2006, AOS) Theory on eigenfunctions and eigenvalues.
2. Covariate adjusted FPCA – Univariate Z • For dense functional data Chiou, Müller & Wang (2003) Cardot (2006) • Their method does not work for sparse dara. • We propose two ways: fFPCA& mFPCA
Rate of Convergence • If E(N) < , the rate of convergence for the 2D mean and covariance function is . - This is the optimal rate of convergence for 2D smoothers with independent data. • If E(N) → , the rate of convergence can be as close to as possible but not equal to . • If , the convergence rate is .