Download
1 / 28
280 likes | 435 Views
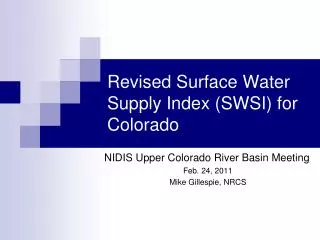
The Colorado Surface Water Supply Index (SWSI) Performance Since 1981. Nolan Doesken Colorado State Climatologist Colorado Climate Center Colorado State University. So whose idea was this anyway???. Background.

E N D
The Colorado Surface Water Supply Index (SWSI) Performance Since 1981 Nolan Doesken Colorado State Climatologist Colorado Climate Center Colorado State University
Background • WATF (Water Availability Task Force) was created within the Drought Response Plan to objectively assess water supply information • Initially used the Palmer Drought Severity Index to trigger drought response actions. • Soon discovered that the Palmer Index was too slow to respond to changes and seemed to perform poorly in seasonal snowpack environments • SWSI was later developed to aid in water availability monitoring in mountainous areas.
SWSI Introduction • Purpose: to be an indicator of basin-wide water availability for the mountain water dependant sector, be predictive and permit comparison of water supply conditions between basins to assess relative drought severity (Shafer and Dezman, 1982) • SWSI seemed to be more robust and responsive to changing conditions than the Palmer index for the mountainous Western U.S. It accounts for known components of water supply -- reservoir storage, streamflow, precipitation and snowpack. SWSI seemed more understandable than the “black box” PDSI model
SWSI Calculation • SWSI = (aPsnow + bPprec + c Pstrm + dPresv -50) / 12 • a = snowpack weighting factor • b = precipitation weighting factor • c = streamflow weighting factor • d = reservoir weighting factor • a+b+c+d = 1 • P = probability of non-exceedance (percent) for component i • snow, prec, strm and resv are the snowpack, precipitation, streamflow and reservoir components, respectively. • Subtraction of 50 centers the distribution around zero • Division by 12 bounds the values between -4.17 and +4.17 to mimic range of Palmer Drought Index. (Shafer and Dezman, 1982)
SWSI Calculation • Normalization was accomplished by using non-exceedance probabilities -- allowing for comparison across varying climates. • Requires representative long-term data or accurate estimates – appropriately representing both wet and dry extremes. • Each of the components is weighted by overall impact in the basin. • Weighting factors change with season (winter versus summer -- snowpack or streamflow) (Shafer and Dezman, 1982)
Weighting Coefficients • May seem arbitrary, but were thoughtfully developed based on known reservoir capacity as percent of average annual streamflow. • Specific process was followed for each basin • Authors knew that coefficients might change monthly, but stuck with two-season approach for simplification
Input Data • Snowpack (SWE) • 6-7 Snow course/SNOTEL stations per basin. • Streamflow – monthly total volume flows • Gages on major streams above diversions were preferable. • 1-4 gages per basin chosen by location, regulation and data availability. • Reservoir Storage • Only managed non-random variable • Both irrigation and municipal reservoirs used to reduce dependence of previous values. • South Platte uses 18 reservoirs, others 4-6, none on Yampa/White/N.Platte • Precipitation • 4-6 National Weather Service stations per basin. • Cumulative water-year values used Dec – May (mimic snowpack), individual monthly amounts for remainder of year. (Shafer and Dezman, 1982)
Example: Snowpack non-exceedance probability for the Rio Grande basin (Shafer and Dezman, 1982)
Things to consider • Discontinuance of stations used in the calculation. • When one or more extreme events occur and go beyond the frequency distribution. • The time series must be reanalyzed. • Changes in water management activities. • New or expansion of existing reservoirs. • Changing reservoir operation “rules” (Shafer and Dezman, 1982)
Additional Consideration • Have you looked at reservoir data lately? • Probability distributions can be quite odd
References • Shafer, B.A.; and L.E. Dezman. 1982. Development of a Surface Water Supply Index (SWSI) to assess the severity of drought conditions in snowpack runoff areas. In Proceedings of the Western Snow Conference, pp. 164–175. Colorado State University, Fort Collins, Colorado.
My personal concluding thoughts • SWSI was developed to be a practical tool • SWSI must be worth something or we would have quit using it long ago • SWSI values below -3 for consecutive months do correspond well to known drought conditions • WATF intended to test SWSI by comparing it to observed drought impacts – don’t think we ever did that, but always perceived it to be practical and useful
More Thoughts • WATF participants always felt that SWSI could be improved -- just weren’t sure it was worth the effort just to satisfy WATF • Fundamental questions • How many basins? How localized? • Monthly coefficients? • Realities of inhomogeneous data • Predictive or Diagnostic?