Download
1 / 19
190 likes | 197 Views
2. Tropical Convection. 2. Tropical Convection. 2. Tropical Convection. 2. Tropical Convection. See http://www.nrlmry.navy.mil/sat-bin/tropics.cgi. 2. Tropical Convection. 2.1 Conditional Instability and CAPE 2.2 Dry Convection 2.3 Available Potential Energy for Convective Downdrafts

E N D
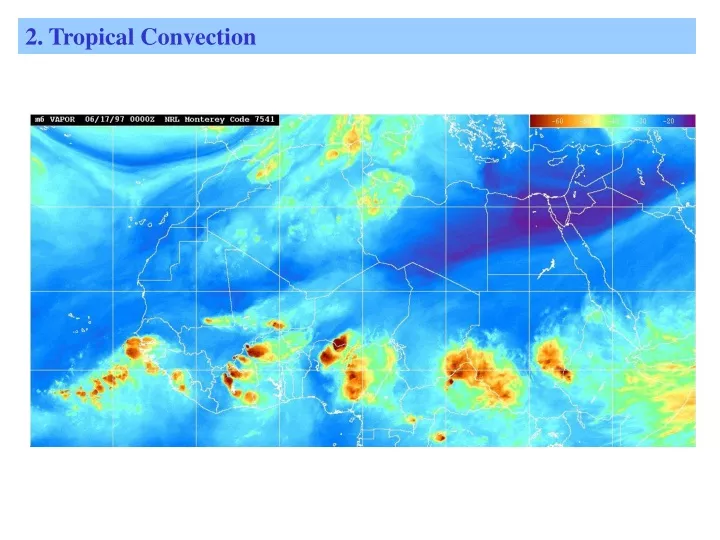
2. Tropical Convection See http://www.nrlmry.navy.mil/sat-bin/tropics.cgi
2. Tropical Convection 2.1 Conditional Instability and CAPE 2.2 Dry Convection 2.3 Available Potential Energy for Convective Downdrafts 2.4 Some Observations over West Africa 2.5 Mesoscale Convective Systems 1 Problem sheet will be given for this section
2.2 Dry Convection (see notes) 2.3 Available Potential Energy for Convective Downdrafts (see notes)
2.4 Some observations from the JET2000 experiment Thorncroft et al, 2003 BAMS Parker et al, 2005 QJRMS
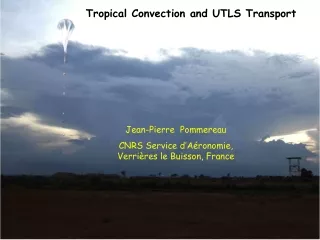
Experimental Details • C130 aircraft flew 4 legs over this region: 25-30 August 2000 • Dropsondes every 0.5-1 degree • Low level flights on north-south transect Met Office C-130 At Niamey Airport, Niger
2-5 day filtered V at 700mb (from ECMWF) Weak AEW activity JET2000 Period
ECMWF PBL fields compared to observations Potential temperature Equivalent potential temperature
Thermodynamic Profiles 28th August 2000 Height of AEJ
Saturated equivalent potential temperature 28th August 2000 Closer to moist adiabatic Close to dry adiabatic
Equivalent Potential Temperature 28th August 2000 Variability in boundary layer θe (surface conditions) Elevated SAL is a region of lateral mixing (e.g. q, aerosol)
Boundary Layer Buoyancy 28th August 2000 Larger CIN and +ve buoyancy Smaller CIN and +ve buoyancy