Download
1 / 11
110 likes | 333 Views
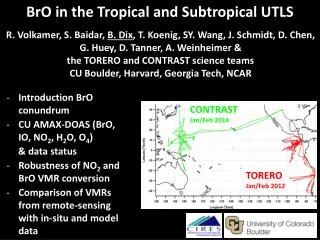
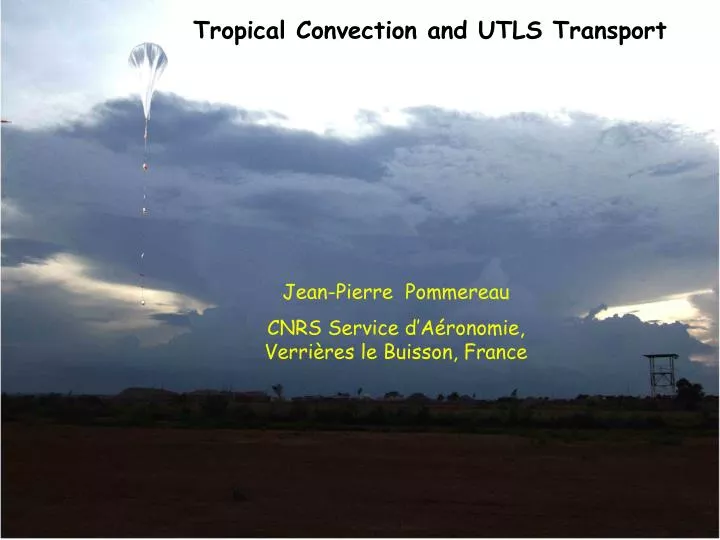
Tropical Convection and UTLS Transport. Jean-Pierre Pommereau CNRS Service d’Aéronomie, Verrières le Buisson, France. 0.4 km/month. Corti et al 2005. Troposphere-Stratosphere Transport.

E N D
Tropical Convection and UTLS Transport Jean-Pierre Pommereau CNRS Service d’Aéronomie, Verrières le Buisson, France
0.4 km/month Corti et al 2005 Troposphere-Stratosphere Transport 0-14 km Fast (hours) convective transport up to Layer of Neutral Buoyancy (LNB), the base of Tropical Tropopause Layer (TTL) 14-20 km Current understanding: Slow (6 months) ascent by radiative heating Question: contribution offast (hours) cumulonimbus overshooting ?
? STRATOSPHERE Top TTL 20 km TTL 16-17 km C PT Bottom TTL 14 km 1O km TROPOSPHERE Temperature O km IMPACT OF OVERSHOOTING UPDRAFTS ? How high ? Where ? How frequent ? How important at global scale?
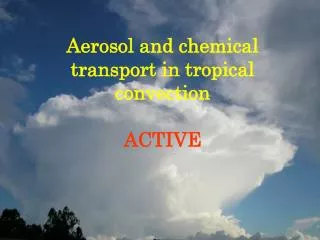
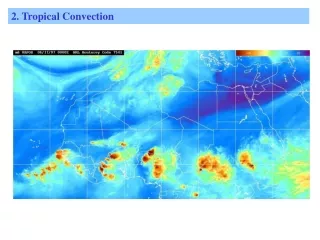
Where and When ? SH Summer Hibiscus / Troccinox Feb 2004 and 2005 SCOUT Darwin Dec 2005 NH Summer SCOUT-AMMA Aug 2006, Aug 2008 TRMM Radar: Frequency of Overshooting Precipitation Features (OPFs) at altitude > 14 km Parts per thousand (Liu and Zipser, 2005)
TRMM Lightning Imaging Sensor (LIS) SH Summer Hibiscus / Troccinox Feb 2004 and 2005 SCOUT Darwin Dec 2005 NH Summer SCOUT-AMMA Aug 2006, Aug 2008 Lightning where vertical velocity is the fastest
WHERE ? Max Height Lightning Yearly average percentage of TRMM extreme events in each 2-degree box Zipser et al. 2006
How studying TST with balloons ? 1. Short flights as close as possible from storms
Rubber sounding balloons SCOUT-AMMA Niamey, Aug 2006, Aug 2008 1200 g balloons Payload <5kg
Plastic sounding balloons Hibiscus, Brazil Feb 2004 SCOUT -AMMA Niamey Aug 2006, Aug 2008 500-5000 m3 Payload 5-30 kg
Small Zodiac ZL & SF balloons Hibiscus, Brazil, Feb 2004 Scout-Amma Aug 2006 10 000 - 12 000 m3 Several instruments Total up to 120 kg Light telemetry/ command
FIGHT STRATEGY As close as possible from fast developping storms (few hours) strong diurnal variation, unpredicted by NWP meteorological models Now forecast only (GOES or MSG pictures, Radars in Bauru and Niamey) High flexibility required : 2-3 hours max between decision and flight MSG picture