Download
1 / 50
500 likes | 524 Views
Explore livestock and crop market trends for 2012 and beyond. Learn about crush margins, feed costs, supply/demand concerns, and crop pricing projections. Discover insights on farm bill proposals, crop insurance changes, and land values in this comprehensive outlook.

E N D
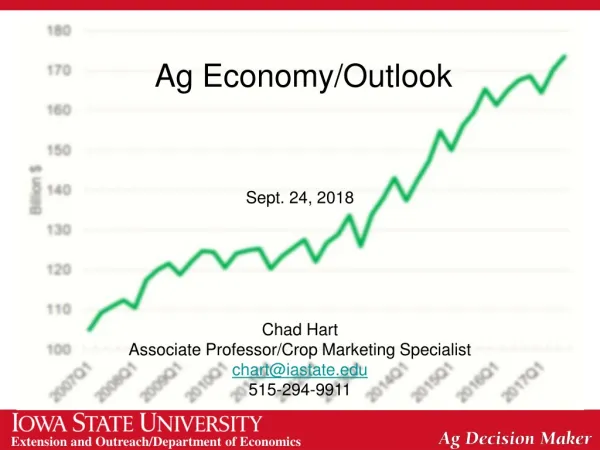
Ag Outlook for 2012 Iowa Realtors Land Institute Meeting Clive, Iowa Dec. 5, 2011 Chad Hart Assistant Professor/Grain Markets Specialist chart@iastate.edu 515-294-9911
Cattle and Hog Prices Source: CME Group
Hog Crush Margin The Crush Margin is the return after the pig, corn and soybean meal costs. Carcass weight: 200 pounds Pig price: 50% of 5 mth out lean hog futures Corn: 10 bushels per pig Soybean meal: 150 pounds per pig Source: Shane Ellis, ISU Extension
Livestock Marketing Information Center Data Source: USDA-NASS, Compiled & Analysis by LMIC
Livestock Marketing Information Center Data Source: USDA-ERS & USDA-FAS, Compiled & Analysis by LMIC
Cattle Crush Margin The Crush Margin is the return after the feeder steer and corn costs. Live weight: 1250 pounds Feeder weight: 750 pounds Corn: 50 bushels per head Source: Shane Ellis, ISU Extension
Livestock Marketing Information Center Data Source: USDA-NASS, Compiled & Analysis by LMIC
Livestock Marketing Information Center Data Source: USDA-ERS & USDA-FAS, Compiled & Analysis by LMIC
Livestock Marketing Information Center Data Source: USDA-NASS, Compiled & Analysis by LMIC
Thoughts for 2012 and Beyond • Continued economic recovery is a major key for livestock prices • Meat demand is recovering • Meat supplies tightened up with smaller herds/flocks • Feed costs have kept margins tight • The combination implies livestock expansion will take awhile • Poultry is currently backing off, Hogs are expanding slightly, and Cattle will not start expanding for a few years
U.S. Corn Supply and Use Source: USDA-WAOB
U.S. Soybean Supply and Use Source: USDA-WAOB
World Corn Production Source: USDA-WAOB
World Soybean Production Source: USDA-WAOB
Corn vs. Wheat Source: CME Group, 12/2/2011
Corn Grind for Ethanol Source: DOE-EIA
Biodiesel Production Source: DOE-EIA
Principal Crop Area Source: USDA-NASS
States with Room to Grow Number is the difference in planted acres between 2008 and 2011
Thoughts for 2012 and Beyond • General economic conditions • Continued worldwide economic recovery is a major key for crop prices • US job recovery, European financial concerns, Chinese inflation • Supply/demand concerns • Smaller than anticipated U.S. crops, worries about dry conditions • Biofuel growth and energy demand • Corn has the upper hand in the acreage competition • Will supply be able to keep pace with demand? • 2011/12: USDA: Corn $6.70; Soy $12.60 • Futures (as of 12/2/11): Corn $5.73; Soy $11.24 • 2012/13: Futures (as of 12/2/11): Corn $5.35; Soy $11.04
Crop Insurance • Two big changes for 2012 • Re-rating for corn and soybeans • Trend adjustment option for APH yields Both will impact Iowa producers
Average Corn Premium Rate Changes Source: RMA
Average Soybean Premium Rate Changes Source: RMA
Trend Adjusted APH Yields Source: Dr. William Edwards, ISU
Farm Bill • With the super committee’s failure, the farm bill returns to its normal timeline and method of deliberation • However, a few nuggets have leaked out about possible farm bill directions • None of these may make it into the final bill, but we know they have been proposed
Farm Bill Proposals • Eliminate direct payments, counter-cyclical payments, ACRE, and SURE • Create Ag Risk Coverage (ARC) program to protect against low prices and/or yields • 87% of producer’s 5-year Olympic average revenue • Max. payment of 12% of revenue • Has price-only option • Payment limits of $105,000 for ARC and no payments for producers with a AGI over $950,000
Farm Bill Proposals • Complete overhaul of dairy programs • Gradually reduce CRP to 25 million acres • Tighten requirements on some nutrition programs • Continue many bioenergy programs
The following slides are land values and rents are from Dr. Mike Duffy His slides, my interpretation
Land Summary Land values are at record levels Increases have been strong but will be affected as fundamentals change Land ownership will become more dispersed and land management will become more concentrated Odds of farmland experiencing a collapse similar to the 1980s or the urban real estate market are not high Farmland is a good long term investment and will likely remain that way for the foreseeable future Farmers are the majority of land purchasers; they buy land to own it, not to sell it
Thank you for your time!Any questions?My web site:http://www.econ.iastate.edu/~chart/Iowa Farm Outlook:http://www.econ.iastate.edu/ifo/Ag Decision Maker:http://www.extension.iastate.edu/agdm/