Download
1 / 27
280 likes | 720 Views
Ecosystem Services: impact of a dam on Opihi river photo - Opuha Water Partnership. 1. Key contributors. Dr Ed Hearnshaw – now Senior Analyst, Ministry for the Environment. Edward.Hearnshaw@mfe.govt.nz Dr Jean Tompkins – now Biodiversity Officer, Environment Canterbury.

E N D
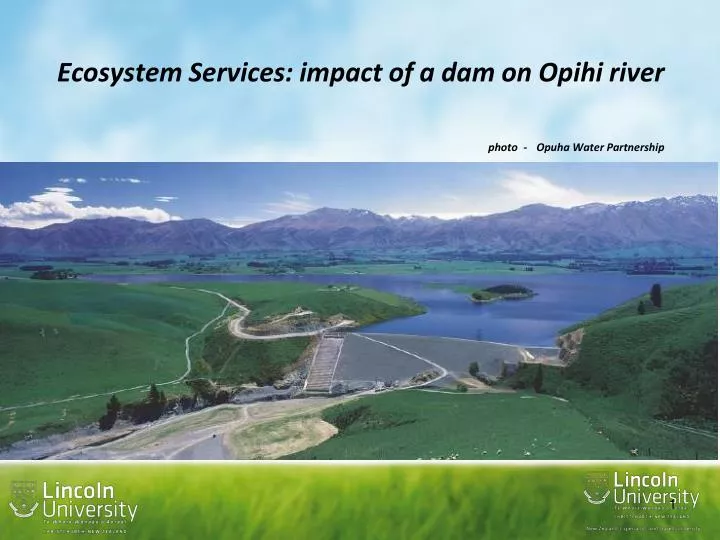
Ecosystem Services: impact of a dam on Opihi riverphoto - Opuha Water Partnership 1
Key contributors Dr Ed Hearnshaw – now Senior Analyst, Ministry for the Environment. Edward.Hearnshaw@mfe.govt.nz Dr Jean Tompkins – now Biodiversity Officer, Environment Canterbury. Jean-Marie.Tompkins@ecan.govt.nz Professor Ken Hughey, Lincoln University
Pressures • Water becoming scarce and rivers stressed by abstraction for irrigation • Water - multiple uses and society needs to consider all uses, not just consumptive uses • Evaluations of water projects need to consider all values to be valid, accepted • Economic evaluations struggle to include all values for water if they are not readily monetised • Ecosystem Services approaches have arisen as a consequence.
Opihi Catchment • Irrigation abstraction, dry river in summers • Levels Plains irrigation began 1936, 3700ha • Declining health of river ecology & loss of river values • Opuha Dam built 1997-98, $34 million • 710 ha lake, water storage for irrigation, electricity generation, boating, fishing, recreation, required to maintain summer flows in Opihi River • Negative effects expected: increased algal growth, loss of natural character
Opuha dam Opihi river
Known outcomes from Opuha Dam • Minimum flow levels maintained in river • Water storage in dam allows much greater water supply for irrigation and industrial uses • Opihi catchment irrigated area - 16,000 ha • Additional $12 million surplus/annum to farmers • Additional $123 million/annum spillover benefits • Estimated 480 additional jobs (Harris et al, 2006) • 2008 resource management award from Environment Canterbury
The ecosystem services approach • Step 1: Ecosystem services (ES) are identified • Step 2: Stakeholder representatives preferentially weight each ecosystem service. • Step 3: Indicators which represent each ecosystem service are collated. • Step 4: The preferential weights and indicator scores of each service are incorporated into a multi-criteria analysis which will produce the ESI. Monitored over time the ESI can indicate sustainability
Ecosystem Services Index Provisioning Ecosystem Services Regulating Ecosystem Services Cultural Ecosystem Services Food Freshwater Supply Fibre Abiotic Products Water Regulation Natural Hazard Regulation Water Purification Disease Regulation Pest Regulation Erosion Control Conservation Values Educational Values Spiritual Values Aesthetic Values Recreational Values Freshwater Supply Fibre Abiotic Products Water Regulation Natural Hazard Regulation Water Purification Disease Regulation Pest Regulation Erosion Control Conservation Values Educational Values Spiritual Values Aesthetic Values Biophysical Indicator A Biophysical Indicator B Socio-Economic Indicator A The ESI is monitored over time. An increasing index value indicates ‘weak’ sustainability (or a movement towards it) ESI = ∑wnsn Classes are preferentially weighted by stakeholders ES are preferentially weighted by stakeholders (w) Expertly verified indicators monitor the state of each ES (normalised scores are aggregated). (s)
Step 1: Ecosystem services of the river are identified • 15 ES are identified for the Opihi River
Data • Pre and post dam time series data needed • Main sources NIWA, MfE, ECan, Fish and Game (CSI) • 42 indicators used • Indicator selection criteria: data availability, communicability, indicator cost
Step 2: Stakeholder preferences • A one-to-nine scale was used, where one represents neutrality or indifference between the pairing and nine represents an overwhelming preference for one ES over the other.
Stakeholder Preferences • 15 regional stakeholders representatives • 6 local stakeholder representatives • Asked to provide preferences from perspective of present needs of stakeholders they represent • Analysed using Expert Choice software
Step 3: Expertly verified indicators which represent each ecosystem service are collated and their safe minimum standards recorded. -The evaluation period was 1989 to 2008. -(Dam construction 1997)An example using the provisioning class of ecosystem services...
Step 4: Using the ESI to evaluate for weak sustainability ESI / # indicators in that year ESI = ∑wnsn Pre-dam Post-dam
Key findings from case study • Fifteen ES were identified from the river • Since dam construction the river has progressed towards weak sustainability in its provision of ES. (Interpretation - needs to acknowledge the state of the river pre-dam) • There is a need to develop a standardised set of effective indicators of river ES -Alternatively ES could be decomposed into more tangible benefits, allowing improved correlation with indicators.
Discussion • Biophysical, economic and social data availability is patchy • Indicators for Regulating and Cultural ES often rely upon biophysical data • Can capture trends in ES if have time series data • Multiple uses of some indicators, danger of double counting • Investment in appropriate time series data a key decision • If can overcome data challenges, ES approaches could be useful to evaluate potential new project
Opuha project papers • Hearnshaw, E, Cullen, R and Hughey, K. 2010. Ecosystem services review of water storage projects in Canterbury: The Opihi River case. Report to Environment Canterbury. http://www.canterburywater.org.nz/downloads/e cosystem-services-review-the-opihi-river-case.pdf • Hearnshaw, EJS, Tompkins, J-M, Cullen, R. 2011. The sustainability and cost effectiveness of water storage projects on Canterbury rivers: The Opihi River case. Australian Agricultural and Resource Economics Society annual conference, Melbourne, 9-11 February. http://ageconsearch.umn.edu/bitstream/100720/2/Tompkins.pdf • Hearnshaw, EJS, Tompkins, J-M, Cullen, R. 2011. Addressing the wicked problem of water resource management on Canterbury rivers. Australian Agricultural and Resource Economics Society annual conference, Melbourne, 9-11 February. http://ageconsearch.umn.edu/bitstream/100556/2/Hearnshaw.pdf