Download
1 / 17
170 likes | 306 Views
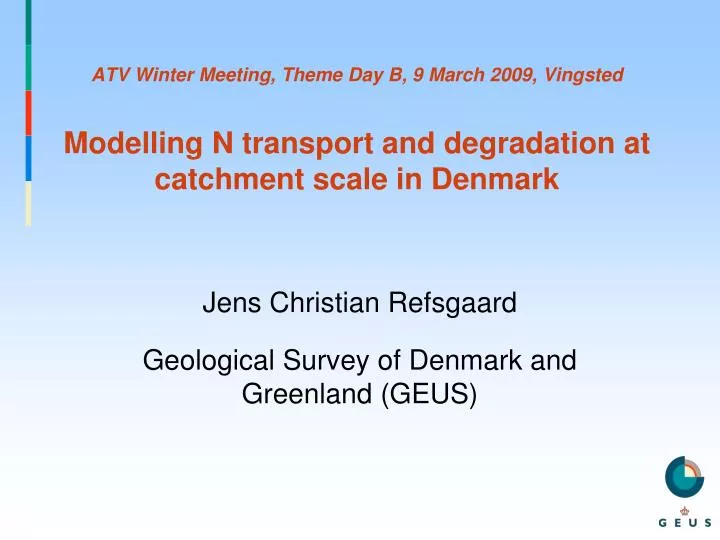
ATV Winter Meeting, Theme Day B, 9 March 2009, Vingsted Modelling N transport and degradation at catchment scale in Denmark. Jens Christian Refsgaard Geological Survey of Denmark and Greenland (GEUS). Objective and outline. Objective

E N D
ATV Winter Meeting, Theme Day B, 9 March 2009, VingstedModelling N transport and degradation at catchment scale in Denmark Jens Christian Refsgaard Geological Survey of Denmark and Greenland (GEUS)
Objective and outline Objective • To describe the status/limits of our present understanding and possible ways forward Outline • Model types and documented performance • N balances • Leaching from root zone • Reduction in subsurface • Reduction in surface water at different scales • National scale • Medium size catchment (Odense Fjord) • Small scale (Søndersø + LOOP) • Conclusions
Catchment N modelling – experiences with different approaches in DK Complex (physically-based, distributed) • DAISY: leaching/root zone processes • MIKE SHE: unsaturated zone below root zone, groundwater • MIKE 11: streams 20 years experience (VMP, catchment and national studies) Intermediate (mix of root zone processes and retention coefficients) • MONERIS, INCA, SWAT, etc Some experience – only research projects (e.g. Euroharp) Simple (Empirical/statistical, lumped) • NLES: leaching • Retention coefficients derived from measured data (lumped) 20 years experience (VMP, national studies) Intercomparison – which model is best? • No model code is universally superior to all other models: model selection should depend on objective of study, data availability etc.
Catchment N balances- general picture, entire Denmark • N leaching from root zone From: Faglig Rapport fra DMU 616/2007
Catchment N balances- general picture, entire Denmark • Reduction in subsurface • Map from Ernstsen et al., GEUS Rapport 2006/93 <50% 50-75% >75%
Catchment N balances- general picture, entire Denmark } • What happens to N leached from root zone ? • Reduction in subsurface system • Reduction in surface water • Load to coastal areas • Conclusions • Majority of reduction takes place in groundwater system • Large uncertainty on these figures/maps From: Faglig Rapport fra DMU 616/2007 From: GEUS Rapport 2006/93 <50% 50-75% >75%
Catchment N balances- example for Odense Fjord (Nielsen et al., 2005, Hansen et al., 2009)
Pesticidtilførslen fordeles mellem plante- og jordoverflade som funktion af plantedækket Nedbrydning af pesticid i jorden beregnes som en 1. ordens proces påvirket af jordtemperatur og -fugtighed Vand- og stoftransport i jordmatricen beregnes ved Richards' ligning kombineret med advektions-dispersions ligningen Vand- og stoftransport i makroporer og udveksling med jordmatricen afhænger af jordvandspotentialet DAISY 1-dimensional - rootzone Plant growth Agricultural management Nitrate MIKE SHE / MIKE 11 3-dimensional - catchment Distributed, physically-based River/wetland water quality DAISY
DAISY-MIKE SHE Sequential coupling 500 m grid 5248 grid cells (horisontal) 47232 computational grid points 6061 DAISY columns
Odense catchment N balance (Hansen et al., 2009) Figures are tonnes N/year
Models can simulate flow paths and reduction at small scale However – accuracy of local scale predictions not documented We do not know how the reliability Probably too uncertain for management decisions
Problem at small scale (Ex. 1)Location of depth to redox interface (Hansen et al., 2008) Depth to redox interface varies spatially at a length scale that is smaller than model grid size
Problem at small scale(Example 1)Upscaling of N-reduction from 25 m grid to 125 m grid (Hansen et al., 2008) Point scale equation Grid scale equation
Problem at small scale(Example 2)N-modelling for LOOP1 (Højvads Rende) • Modelling study in progress – preliminary results • Experimental agricultural catchment – part of national monitoring (LOOP1) • Catchment area: 10 km2 • 3 river stations (2 - 10 km2 ) • 4 drainwater stations (2 – 6 ha) • Lot of data • Modelling strategy and partners • Leaching from root zone • DAISY • Carried out by DMU (NERI) • Catchment transport, retention, reduction • MIKE SHE / MIKE 11 • Carried out by Alectia • Client: Environment Centre Nykøbing F, Ministry of Environment
Problem at small scale(Example 2)N-modelling for LOOP1(Preliminary results produced by Alectia) • Simulations of annual water balance – model deviations • River stations: 10 – 60% errors • Drain stations: 40 – 400% errors • Simulations of annual N load • Downstream river station: OK • Upstream river stations: Mixed • Drain stations: Poor • Conclusions regarding capability of N modelling related to scale State-of-the-art modelling methodology applied A model can be tuned to fit observed data, also at small scale, through calibration of local scale parameters Model performance deteriorates when you extract results from smaller scale than entire catchment where model calibration was performed
Conclusions • Majority of N reduction takes place in groundwater systems – we cannot predict precisely where it takes place More attention required to subsurface N reduction • Small scale heterogeneity of geology (e.g. depth to redox interface) often dominates when describing N reduction at larger scales We need to account for geological heterogeneity • Predictive capability of N reduction in subsurface • Large scale (national, large catchments): OK for general regulations of N leaching from agriculture • Small scale (subareas, small catchments): Not good enough for designing local (farm level) regulations We need better knowledge and tools to assess N transport and reduction at small scales (< 100 km2)
More information • Ernstsen V, Højberg AL, Jakobsen PR, von Platen F, Tougaard L, Hansen JR, Blicher –Mathiasen G, Bøgestrand J, Børgesen CD (2006) Calculation of nitrate reduction coefficients for the zone between the root zone and the rivr system. GEUS Report 2006/93 (In Danish) • Blicher-Mathiesen G, Bøgestrand J, Kjeldgaard A, Ernstsen V, Højberg AL, Jakobsen PR, von Platen F, Tougaard L, Hansen JR, Børgesen CD (2007) Nitrate reduction from teh root zone to the coast for Denmark. Faglig rapport fra DMU nr. 616. (In Danish) • Nielsen K, Andersen HE, Larsen SE, Kronvang B, Stjernholm M, Styczen M, Poulsen RN, Villholth K, Krogsgaard J, Dahl-Madsen KI, Friis-Christensen A. Uhrenholdt T, Hansen IS, Pedersen SE, Jørgensen O, Windolf J, Jensen MH, Refsgaard JC, Hansen JR, Ernstsen V, Børgesen CD, Wiggers L (2004) Odense Fjord. Scenaries for reduction of nutrients. Faglig rapport fra DMU 485, In Danish). • Hansen JR, Ernstsen V, Refsgaard JC, Hansen S (2008) Field scale heterogeneity of redox conditions in till - upscaling to a catchment nitrate model. Hydrogeology Journal, 16, 1251-1266. http://dx.doi.org/10.1007/s10040-008-0330-1 • Hansen JR, Refsgaard JC, Ernstsen V, Hansen S, Styczen M, Poulsen RN (2009) An integrated and physically based nitrogen cycle catchment model. Hydrology Research. (accepted)