Download
1 / 61
1.09k likes | 1.94k Views
GRAPHICAL ANALYSIS OF MOTION. GRAPHICAL ANALYSIS OF MOTION. m otion graphs come in three formats. GRAPHICAL ANALYSIS OF MOTION. m otion graphs come in three formats Position vs. time graph . GRAPHICAL ANALYSIS OF MOTION. m otion graphs come in three formats Position vs. time graph

E N D
GRAPHICAL ANALYSIS OF MOTION motion graphs come in three formats
GRAPHICAL ANALYSIS OF MOTION motion graphs come in three formats • Position vs. time graph
GRAPHICAL ANALYSIS OF MOTION motion graphs come in three formats • Position vs. time graph • Velocity vs. time graph
GRAPHICAL ANALYSIS OF MOTION motion graphs come in three formats • Position vs. time graph • Velocity vs. time graph • Acceleration vs. time graph
GRAPHICAL ANALYSIS OF MOTION motion graphs come in three formats • Position vs. time graph • Velocity vs. time graph • Acceleration vs. time graph ( this graph is of little use in our course)
GRAPHICAL ANALYSIS OF MOTION motion graphs come in three formats • Position vs. time graph • Velocity vs. time graph • Acceleration vs. time graph ( this graph is of little use in our course) Each graph is a function of time
GRAPHICAL ANALYSIS OF MOTION all formats use a Cartesian System for graphing 6 5 position (m) 4 3 2 1 0 0 1 2 3 4 5 6 7 time (sec)
GRAPHICAL ANALYSIS OF MOTION all formats use a Cartesian System for graphing time is always on the X axis (abscissa) independent variable
GRAPHICAL ANALYSIS OF MOTION all formats use a Cartesian System for graphing time is always on the X axis (abscissa) independent variable position, velocity, and acceleration are always on the Y axis (ordinate) dependent variable
Position vs. Time Graph 6 5 position (m) 4 3 2 1 0 0 1 2 3 4 5 6 7 time (sec)
Velocity vs. Time Graph 6 5 velocity ( m/s) 4 3 2 1 0 0 1 2 3 4 5 6 7 time (sec)
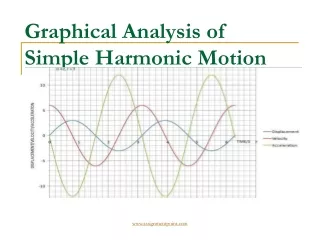
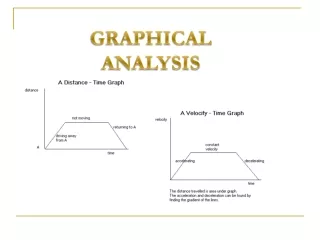
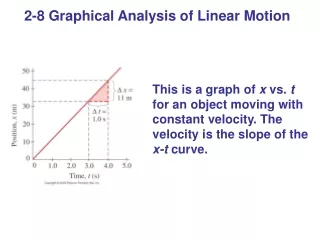
Position vs. Time Graph This is a graph of positionvs. t for an object moving with constant velocity. The velocity is the slope of the y-tcurve.
Position vs. Time Graph Information provided a. Measured Position at a specific time b. Estimated Position between two known points c. Slope of line gives average velocity between any two Cartesian points d. Slope of line can determine instantaneous velocity
One-Dimensional Displacement and Velocity: Vector Quantities Different ways of visualizing uniform velocity:
One-Dimensional Displacement and Velocity: Vector Quantities This object’s velocity is not uniform. a. the average velocity between any two points can be found by finding the slope of a line drawn between any two points
One-Dimensional Displacement and Velocity: Vector Quantities This object’s velocity is not uniform. a. The average velocity between any two points can be found by finding the slope of a line drawn between any two points b. The red line indicates a positive slope and therefore a positive velocity
One-Dimensional Displacement and Velocity: Vector Quantities • This object’s velocity is not uniform. • a. The average velocity between any two points can be found by finding the slope of a line drawn between any two points • b. The red line indicates a negative slope and therefore a negative velocity • the negative indicates direction • the object may be moving towards the origin
One-Dimensional Displacement and Velocity: Vector Quantities • This object’s velocity is not uniform. • a. The average velocity between any two points can be found by finding the slope of a line drawn between any two points • b. The red line is horizontal between these two points • The average velocity is zero during this time period • the object the object is moving, but its position is unchanged between points • 2 & 5
One-Dimensional Displacement and Velocity: Vector Quantities This object’s velocity is not uniform. a. The average velocity between any two points can be found by finding the slope of a line drawn between any two points b. The red line is tangent to a point on the curved line c. This tangent line indicates an instantaneous velocity at a particular time
One-Dimensional Displacement and Velocity: Vector Quantities This object’s velocity is not uniform. a. The average velocity between any two points can be found by finding the slope of a line drawn between any two points b. The red line is horizontal to a point on the curved line c. This tangent line indicates the instantaneous velocity is zero at this particular time
Graphical Analysis of Linear Motion On the left we have a graph of velocity vs. time for an object with varying velocity; on the right we have the resulting position vs. time curve. The instantaneous velocity is tangent to the curve at each point.
Position vs. Time Graph 6 5 position (m) 4 3 2 1 0 0 1 2 3 4 5 6 7 time (sec)
Position vs. Time Graph 6 5 position (m) 4 3 2 1 0 0 1 2 3 4 5 6 7 time (sec) Find the position of this object at times 0.0, 2.0 sec, 5.0 sec, 5.5 sec
Position vs. Time Graph 6 5 position (m) 4 3 2 1 0 0 1 2 3 4 5 6 7 time (sec) Find the slope and velocity of this object
Position vs. Time Graph 6 5 position (m) 4 3 2 1 0 0 1 2 3 4 5 6 7 time (sec) Pick two points on the line
Position vs. Time Graph 6 5 position (m) 4 3 2 1 0 0 1 2 3 4 5 6 7 time (sec) Determine the Cartesian point values of the two points
Position vs. Time Graph 6 5 (5.9, 4.9) position (m) 4 3 2 ( 1.9,2.0) 1 0 0 1 2 3 4 5 6 7 time (sec) Determine the Cartesian point values of the two points
Position vs. Time Graph • Finding Velocity on a position vs. time graph when object has a constant velocity • Draw straight line between the two points being analyzed (1.9 sec and 5.9sec) • Determine the slope of the line • Slope = rise/run = ΔY/ ΔX = (4.9- 2.0)m/(5.9- 1.9)sec = 2.9m/4.0sec = 0.725m/s = 0.73m/s The average velocity between times 1.9 & 5.9 sec is 0.73m/s
Position vs. Time Graphof an object with a variable velocity 6 5 position (m) 4 3 2 1 0 0 1 2 3 4 5 6 7 time (sec)
Position vs. Time Graphof an object with a variable velocity 6 5 position (m) 4 3 2 Find average velocity of object between 0.0 and 4.0 sec 1 0 0 1 2 3 4 5 6 7 time (sec)
Position vs. Time Graphof an object with a variable velocity 6 5 position (m) 4 3 2 Find average velocity of object between 0.0 and 4.0 sec 1 0 0 1 2 3 4 5 6 7 time (sec)
Position vs. Time Graphof an object with a variable velocity 6 (4.0, 5.5) 5 position (m) 4 3 ( 0.0,3.0) 2 Find average velocity of object between 0.0 and 4.0 sec 1 0 0 1 2 3 4 5 6 7 time (sec)
Position vs. Time Graphof an object with a variable velocity • Finding Average Velocity on a position vs. time graph • Draw straight line between the two points being analyzed • Determine the slope of the line • Slope = average velocity of the object • Slope = rise/run = ΔY/ΔX = (5.5- 3.0)m/(4.0- 0.0)sec = 2.5m/4.0sec = 0.625m/s = 0.63 m/s Average velocity at between 0.0 sec and 4.0 sec is 0.63m/s
Position vs. Time Graphof an object with a variable velocity 6 5 position (m) 4 3 2 Find instantanious velocity of object at 2.0 sec 1 0 0 1 2 3 4 5 6 7 time (sec)
Position vs. Time Graphof an object with a variable velocity 6 5 position (m) 4 3 2 Find instantanious velocity of object at 2.0 sec place tangent line at 2.0 sec point 1 0 0 1 2 3 4 5 6 7 time (sec)
Position vs. Time Graphof an object with a variable velocity 6 5 position (m) 4 3 2 Find instantanious velocity of object at 2.0 sec find two points on the tangent line 1 0 0 1 2 3 4 5 6 7 time (sec)
Position vs. Time Graphof an object with a variable velocity 6 (3.5, 6.2) 5 position (m) 4 (3.8, 0.0) 3 • Find instantanious velocity of object at 2.0 sec find two points on the tangent line label the points 1 0 0 1 2 3 4 5 6 7 time (sec)
Position vs. Time Graphof an object with a variable velocity 6 (3.5, 6.2) 5 position (m) 4 (0.0, 3.8) 3 • Find instantanious velocity of object at 2.0 sec find two points on the tangent line label the points 1 determine slope of tangent line 0 0 1 2 3 4 5 6 7 time (sec)
Position vs. Time graph • Find instantaneous velocity of an object with variable velocity • Find slope of the tangent line • tangent = slope ( 0.0s,3.8m) & (3.5s,6.2m) • find the slope of the tangent line • Slope = rise/run = ΔY/ΔX = (6.2-3.8)m/(3.5-0.0)sec = 2.4m/3.5sec = 0.6857m/s = 0.69 m/s Instantaneous velocity at 2.0 sec = 0.69m/s
Position vs. Time Graphof an object with a variable velocity 6 5 position (m) 4 3 2 Find instantaneous velocity of object at 5.5 sec 1 0 0 1 2 3 4 5 6 7 time (sec)
Position vs. Time Graphof an object with a variable velocity 6 5 position (m) 4 3 2 Find instantaneous velocity of object at 5.5 sec 1 0 0 1 2 3 4 5 6 7 time (sec)
Position vs. Time Graphof an object with a variable velocity 6 5 position (m) 4 3 2 Find instantaneous velocity of object at 5.5 sec place a tangent line at this point 1 0 0 1 2 3 4 5 6 7 time (sec)
Position vs. Time Graphof an object with a variable velocity 6 5 position (m) 4 (5.0,4.0) 3 (6.2,3.0) 2 Find instantaneous velocity of object at 5.5 sec determine two points on the tangent line 1 0 0 1 2 3 4 5 6 7 time (sec)
Position vs. Time Graphof an object with a variable velocity • Find slope of the tangent line • tangent = slope ( 5.0s,4.0m) (6.2s,3.0m) • find the slope of the tangent line • Slope = rise/run = ΔY/ ΔX = (3.0-4.0)m/(6.2-5.0)sec = -1.0m/1.2sec = -0.833m/s = -0.83 m/s Instantaneous velocity at 5.5 sec = -0.83 m/s
Position vs. Time graph Instantaneous velocity at 5.5 sec = -0.83 m/s The negative sign indicates the direction the object is moving. The object is moving in the negative X direction The object is not moving at a speed less than zero
Graphical Analysis of Linear Motion On the left we have a graph of velocity vs. time for an object with varying velocity; on the right we have the resulting position vs. time curve. The instantaneous velocity is tangent to the curve at each point.
Velocity vs. Time Graph 6 5 velocity ( m/s) 4 3 2 1 0 0 1 2 3 4 5 6 7 time (sec)
Velocity vs. Time Graph 6 5 Velocity ( m/s) 4 3 2 1 0 0 1 2 3 4 5 6 7 -1 time (sec)
Velocity vs. Time Graph • Information That can be obtained from a velocity time graph a. Measured Velocity at a specific time b. Estimated velocity between two known points c. Slope of line gives average acceleration between two points d. Slope of line can give instantaneous acceleration e. Area under the curve can determine displacement of object