Download
1 / 54
540 likes | 620 Views
Ventilation and Cardiovascular Dynamics. Brooks Ch 13 Ch 14 - 299-308 Ch 15 - 315-316,325-326,329-330 Ch 16. Outline. Cardio-Respiratory responses to exercise VO 2 max Anaerobic hypothesis Noakes protection hypothesis Limits of Cardio-Respiratory performance

E N D
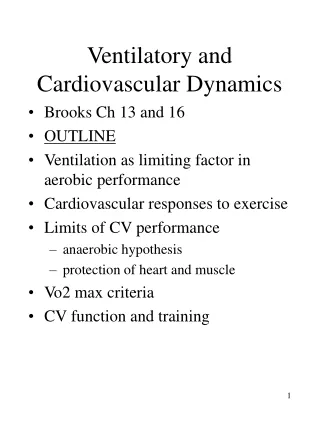
Ventilation and Cardiovascular Dynamics Brooks Ch 13 Ch 14 - 299-308 Ch 15 - 315-316,325-326,329-330 Ch 16
Outline • Cardio-Respiratory responses to exercise • VO2max • Anaerobic hypothesis • Noakes protection hypothesis • Limits of Cardio-Respiratory performance • Is Ventilation a limiting factor in VO2max or aerobic performance? • Cardio-respiratory adaptations to training
Cardio-Respiratory System Rest vs Maximal Exercise Table 16.1(Untrained vs Trained vs Elite athletes) RestMax ExRestMax Ex RestMax Ex UT UT TT E E HR(bpm) 70 185 63 182 45 182 SV (ml/beat) 72 90 80 105 136 184 (a-v)O2(vol%)5.6 16.2 5.6 16.5 Q(L/min) 5 16.6 5 19.1 5 35 VO2 ml/kg/min 3.5 35.8 3.5 42 3.5 80 SBP(mmHg) 120 200 114 200 Vent(L/min) 10.2 129 10.3 145 Ms BF(A)ml/min 600 13760 555 16220 CorBFml/min 260 900 250 940
Oxygen Consumption • With exercise of increasing intensity, there is a linear increase in O2 consumption • VO2 = Q * (a-v)O2 (Fick Equation) • Cardiovascular response determined by • rate of O2 transport (Q) • amount of O2 extracted (a-v)O2 • Fig 16-2,3,4 • O2 carrying capacity of blood (Hb content of blood) • Changes in Q and (a-v)O2 important when moving from low to moderate intensities • changes in HR become more important when moving from moderate to high intensity
Heart Rate • important factor in responding to acute demand • HR inc with increasing intensity is due to; • Sympathetic stimulation (fig 9-11) and Parasympathetic withdrawal • Mechanical (stretch) and chemical (metabolites) feedback to CV control center • HR response influenced by anxiety, dehydration, temperature, altitude, digestion • estimated Max HR 220 - age (+/- 12) • Steady state - leveling off of heart rate to match oxygen requirement of exercise (+/- 5bpm) • Takes longer as intensity of exercise increases, may not occur at very high intensities • Cardiovascular drift - HR may increase with prolonged exercise at steady state • may be due to inc skin blood flow with temp • may be due to decreased stroke volume with dehydration or breakdown of sympathetic blood flow control
Heart Rate • HR response : • Is higher with upper body - at same power requirement • Due to : smaller muscle mass, increased intra-thoracic pressure, less effective muscle pump, feedback to control center • Is less significant during strength training • Inc with ms mass used • Inc with percentage of MVC (maximum voluntary contraction) • Rate Pressure Produce - RPP • HR X Systolic BP • Good estimate of the workload of the heart , myocardial oxygen consumption, with
Stroke volume • Stroke Volume - volume of blood per heart beat • Rest - 70 - 80 ml ; Max - 80-175 ml • Fig 16-3 - SV increases with intensity to ~ 25-50% VO2max - then plateaus • Fig 14.7 - Factors affecting SV during exercise • Pre load - end diastolic pressure (volume) • Affected by changes in Q, posture, venous tone, blood volume, atria, muscle pump, intrathoracic pressure. • Frank Starling Mechanism (fig 14.8) • After load - resistance to ventricular emptying • Contractility - inc by sympathetic stimulation (fig 14-10) • SV biggest difference when comparing elite athletes and sedentary population~ same max HR - double the SV and Q
(a-v)O2 difference • Difference between arterial and venous oxygen content across a capillary bed • (ml O2/dl blood -units of %volume also used) (dl = 100ml) • (a-v)O2 difference - depends on • capacity of mitochondria to use O2 • rate of diffusion • blood flow (capillarization) • (a-v)O2 difference increases with intensity • fig 16-4 - rest 5.6 - max 16 (vol %) (ml/100ml) • always some oxygenated blood returning to heart - non active tissue • (a-v) O2 can approach 100% extraction of in maximally working muscle • 20 vol %
Blood Pressure • Blood Pressure fig 16-5 • BP = Q * total peripheral resistance (TPR) • dec TPR with exercise to 1/3 resting cue to vasodilation in active tissues • Q rises from 5 to 25 L/min • systolic BP goes up steadily with intensity • MAP - mean arterial pressure • 1/3 (systolic-diastolic) + diastolic • diastolic relatively constant • Rise of diastolic over 110 mmHg - associated with CAD
Circulation and its Control • With exercise - blood is redistributed from inactive to active tissue beds • the priority for brain and heart circulation are maintained • Skeletal muscle blood flow is influenced by balance between metabolic factors and the maintenance of blood pressure • Fig 17.3 a,b Exercise Physiology , McCardle, Katch and Katch
Circulation and its Control • Metabolic (local) control is critical in increasing O2 delivery to working muscle • sympathetic stimulation increases with intensity • Causes general vasoconstriction in the whole body • brain and heart are spared vasoconstriction • Active (exercise) hyperemia - directs blood to working muscle - flow is regulated at terminal arterioles and large arteries • vasodilators decrease resistance to flow into active tissue beds • adenosine, low O2, low pH, high CO2, Nitric Oxide(NO), K+, Ach, • Figs 9.3 and 9.4 (Advanced cv ex physiology - 2011- Human Kinetics) • Increases capillary perfusion • Increases flow in feed arteries through conducted vasodilation • Vasodilation in distal vessels spreads proximally through cell to cell communication between endothelial cells and smooth ms cells
Circulation and its control • maintenance of BP priority “cardiovascular triage” • Near maximum exercise intensities, the working muscle vasculature can be constricted • This protective mechanism maintains blood pressure and blood flow to the heart and CNS • This may limit exercise intensity so max Q can be achieved without resorting to anaerobic metabolism in the heart • Experimental Eg - changing the work of breathing alters blood flow to active muscle
Cardiovascular Triage • Experimental Eg. Altitude study fig 16-6 - observe a reduction in maximum HR and Q with altitude • illustrates protection is in effect as we know a higher value is possible
Cardiovascular Triage • Experimental Eg - • one leg exercise - muscle blood flow is high • two leg exercise - muscle blood flow is lower • to maintain BP, vasoconstriction overrides the local chemical signals in the active muscle for vasodilation
Coronary blood flow • Large capacity for increase • (260-900ml/min) • due to metabolic regulation • flow occurs mainly during diastole • Increase is proportional to Q • warm up - facilitates increase in coronary circulation
VO2max • Maximal rate at which individual can consume oxygen - ml/kg/min or L/min • long thought to be best measure of CV capacity and endurance performance • Fig 16-7
VO2 max • Criteria for identifying if actual VO2 max has been reached • Exercise uses minimum 50% of ms mass • Results are independent of motivation or skill • Assessed under standard conditions • Perceived exhaustion (RPE) • R of at least 1.1 • Blood lactate of 8mM (rest ~.5mM) • Peak HR near predicted max
What limits VO2 max ? • Traditional Anaerobic hypothesis for VO2max • After max point - anaerobic metabolism is needed to continue exercise - we observe a plateau (fig 16-7) • max Q and anaerobic metabolism will limit VO2 max • this determines fitness and performance • Tim Noakes,Phd - South Africa (1998) • Protection hypothesis for VO2max • CV regulation and muscle recruitment are regulated by neural and chemical control mechanisms • prevents damage to heart, CNS and skeletal muscle • regulates force and power output and controls blood flow • Still very controversial - not accepted by many scholars
Inconsistencies in Anaerobic hypothesis • Q dependant upon and determined by coronary blood flow • Max Q implies cardiac fatigue - ischemia -? Angina pectoris? - pain does not occur in healthy subjects • Blood transfusion and O2 breathing • inc performance - many says this indicates Q limitation • But still no plateau, was it actually a Q limitation? • DCA improves VO2max without changing muscle oxygenation • Stimulates pyruvate dehydrogenase • altitude - observe decrease in Q (fig 16-6) • This is indicative of a protective mechanism • Discrepancies between performance and VO2 max • Elite athletes, changes with training, blood doping
Practical Aspects of Noakes Hypothesis • regulatory mechanisms of Cardio Respiratory and Neuromuscular systems facilitate intense exercise • until it perceives risk of ischemic injury • Then prevents muscle from over working and potentially damaging these tissues • Therefore, improve fitness / performance by; • muscle power output capacity • substrate utilization • thermoregulatory capacity • reducing work of breathing • These changes will reduce load on heart • And allow more intense exercise before protection is instigated • CV system will also develop with training
VO2 max versus Endurance Performance • Endurance performance - ability to perform in endurance events (10km, marathon, triathlon) • General population -VO2 max will predict endurance performance - due to large range in values • elite -ability of VO2max to predict performance is poor • athletes all have values of 65-70 + ml/kg/min • world record holders for marathon • male 69 ml/kg/min female 73 ml/kg/min - VO2 max • male ~15 min faster with similar VO2max • Observe separation of concepts of VO2max / performance • Lower VO2 max recorded for cycling compared to running • Running performance can improve without an increase in VO2 max • Inc VO2 max through running does not improve swimming performance
VO2 max versus Endurance Performance • other factors that impact endurance performance • Maximal sustained speed (peak treadmill velocity) • ability to continue at high % of maximal capacity • lactate clearance capacity • performance economy • Thermoregulatory capacity • high cross bridge cycling rate • muscle respiratory adaptations • mitochondrial volume, oxidative enzyme capacity
VO2 max versus Endurance Performance • Relationship between Max O2 consumption and upper limit for aerobic metabolism is important 1. VO2 max limited by O2 transport • Q and Arterial content of O2 • ? or protection theory 2. Endurance performance limited by Respiratory capacity of muscle (mitochondria and enzyme content) • Evidence • Fig 33-10 restoration of dietary iron • hematocrit and VO2 max responded rapidly and in parallel • muscle mitochondria and running endurance - improved more slowly, and in parallel
VO2 max versus Endurance Performance • Table 6.3 - Correlation matrix • VO2 and Endurance Capacity .74 • Muscle Respiratory capacity and Running endurance.92 • Training results in 100% increase in muscle mitochondria and 100 % inc in running endurance • Only 15% increase in VO2 max • VO2 changes more persistent with detraining than respiratory capacity of muscle • Again illustrating independence of VO2 max and endurance
Is Ventilation a limiting Factor? • Ventilation (VE) does not limit sea level VO2max or aerobic performance in healthy subjects • There is sufficient ventilatory reserve to oxygenate blood passing through the lungs • The following evidence comes from investigating the rate limiting factor in the processes of oxygen utilization • 1. Capacity to increase ventilation is greater than the capacity to increase Q or oxygen consumption • 2. Alveolar surface area is extremely large compared to pulmonary blood volume. • 3. Alveolar partial pressure of O2 (PAO2) increases during exercise • 4. arterial partial pressure of O2 (PaO2) is maintained • 5. Alveolar - arterial O2 gradient widens during max effort • 6. Ventilatory capacity may not even be reached during max exercise
Is Ventilation a limiting Factor? • 1. Capacity to increase ventilation is greater than the capacity to increase Q or oxygen consumption • Fig 13-2 VO2/Q • Q rest 5L/min - ex 25 L/min • VO2/Q ratio ~ .2 at rest and max • Oxygen use and circulation increase proportionally with exercise • Ventilation perfusion Ratio - VE/Q • VE rest 5 L/min - exercise 190 L/min • VE/Q ratio • ~1 at rest - inc 5-6 fold to max exercise • Capacity to inc VE much greater than capacity to increase Q
Ventilation as a limiting Factor to performance? • Ventilatory Equivalent VE/VO2 • Fig 12-15 - linear increase in vent with intensity to ventilatory threshold - then non linear • VE rest 5 L/min - exercise 190 L/min • VO2 .25 L/min - exercise 5 L/min • VE/ VO2 : rest 20 (5/.25) ; max 35(190/5)
Ventilation as a limiting Factor to performance? • 3,4,5. PAO2(alveolar) and PaO2 (arterial) • Fig 11-4 • PAO2 - rises • PaO2 well maintained
Ventilation as a limiting Factor? • 6. Capacity of Ventilation • MVV - maximum voluntary ventilatory capacity • VE at VO2max often less than MVV • athletes post exhaustive exercise can still raise VE to MVV, illustrating reserve capacity for ventilation • MVV tests • With repeat trials - performance decreases • while fatigue is possible in these muscles, it may not be relevant • If VE does not reach MVV during exercise, fatigue and rate limitation is less likely
Elite Athletes • Fig 13-3 - observe decline in PaO2 with maximal exercise in some elite athletes
Elite Athletes • may see ventilatory response blunted, even with decrease in PaO2 • may be due to economy • extremely high pulmonary flow, inc cost of breathing, any extra O2 used to maintain this cost • ? Rise in PAO2 - was pulmonary vent a limitation, or is it a diffusion limitation due to very high Q ?
Cardiovascular Adaptations with Endurance TrainingTable 16.2 RestSubmax ExMax Ex (absolute) VO2 0 0 Q 0 0 HR 0 SV (a-v)O2 0 SBP 0 0 0 CorBFlow Ms Bflow(A) 0 0 BloodVol HeartVol • 0 = no change
CV Adaptations • O2 consumption • improvements depend on • prior fitness, type of training, age • can inc VO2 max ~20% • Performance can improve much more than 20% • Impacts are sport specific • Cardiac Output (Q) • Same for a given absolute submaximal workrate (VO2), • Q increases dramatically at maximal exercise due to increased stroke volume
CV Adaptations • Heart Rate • training-decreases resting and submax HR • Increased Psympathetic (vagal) tone to SA node • Observed after 4 weeks of brisk walking • faster recovery of resting HR evidence of improved PS tone • Max HR may decrease ~3 bpm with training (not significant) • Stroke volume - 20% increase -at rest, sub and maximal after training • End Diastolic Volume increases with training - • inc blood volume (20-25%) - increases venous return • slower heart rate - increases filling time • inc left vent volume and compliance • Myocardial contractility increases • Better release and reuptake of calcium at Sarcoplasmic Reticulum • Shift in isoform of myosin ATPase to V1 • Improves Q by about 15 to 20% • increased ejection fraction
CV Adaptations • (a-v)O2 difference • inc slightly with training due to ; • right shift of Hb saturation curve • mitochondrial adaptation • Hemoglobin mass increases 25% • muscle capillary density