Download
1 / 37
370 likes | 374 Views
Ventilation and Cardiovascular Dynamics. Brooks Ch 13 and 16. Outline. Is Ventilation a limiting factor in aerobic performance? Cardiovascular responses to exercise Limits of CV performance Anaerobic hypothesis Noakes protection hypothesis CV function and training.

E N D
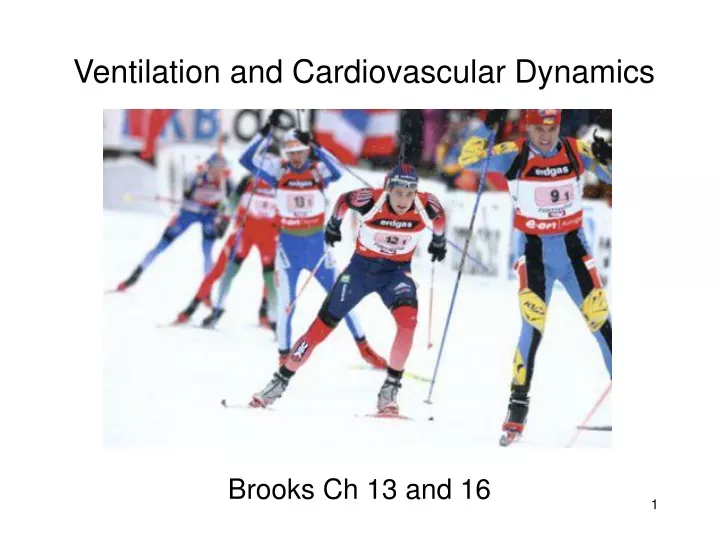
Ventilation and Cardiovascular Dynamics Brooks Ch 13 and 16
Outline • Is Ventilation a limiting factor in aerobic performance? • Cardiovascular responses to exercise • Limits of CV performance • Anaerobic hypothesis • Noakes protection hypothesis • CV function and training
Ventilation as a limiting Factor to performance • Ventilation does not limit sea level aerobic performance • capacity to inc ventilation is greater than that to inc Q • Ventilation perfusion Ratio - VE/Q • Fig 12-15 - linear increase in vent with intensity to vent threshold - then non linear • VE rest 5 L/min -exercise 190 L/min
Ventilation as a limiting Factor to performance • Fig 13-2 • Q rest 5L/min - ex 25 L/min • VO2/Q ratio ~ .2 at rest and max • VE/Q ratio • ~1 at rest - inc 5-6 fold to max exercise • Capacity to inc VE much greater • Ventilatory Equivalent VE/VO2 • rest 20 (5/.25) ; max 35(190/5)
VE max vs. MVV • MVV - max voluntary ventilatory capacity • 1.max VE often less than MVV • 2.PAO2(alveolar) and PaO2 (arterial) • Fig 11-4 , 12-12 • maintain PAO2 - or rises • PaO2 also well maintained
VE max vs. MVV • 3. Alveolar surface area - is very large • 4. Fatigue of Vent musculature • MVV tests - reduce rate at end of test • repeat trials - shows decreased performance • Yes, fatigue is possible in these muscles - is it relevant -NO • VE does not reach MVV during exercise, so fatigue less likely • Further, athletes post ex can raise VE to MVV, illustrating reserve capacity for ventilation
Elite Athletes • Fig 13-3 - observe decline in PaO2 with maximal exercise in some elite athletes
Elite Athletes • may see vent response blunted, even with dec in PaO2 • may be due to economy • extremely high pulmonary flow, inc cost of breathing, any extra O2 used to maintain this cost • ? Rise in PAO2 - was pulmonary vent a limitation, or is it diffusion due to very high Q ? • Altitude • experienced climbers - breathe more - maintain Pa O2 when climbing • Elite - may be more susceptible to impairments at altitude
CV Responses to Exercise • Increase flow to active areas • decrease flow to less critical areas • Principle responses • Inc Q - HR, SV • Inc Skin blood flow • dec flow to viscera and liver • vasoconstriction in spleen • maintain brain blood flow • inc coronary blood flow • inc muscle blood flow
CV Responses to Exercise • Table 16-1 - Rest vs acute exercise • CV response - depends on type and intensity of activity • dynamic - inc systolic BP; not Diastolic • Volume load • strength - in systolic and diastolic • Pressure load
Cardiovascular System Rest vs Maximal Exercise Table 16.1(untrained vs trained) RestMax Ex UT T UT T HR(bpm) 70 63 185 182 SV (ml/beat) 72 80 90 105 (a-v)O2(vol%)5.6 5.6 16.2 16.5 Q(L/min) 5 5 16.6 19.1 VO2 ml/kg/min 3.7 3.7 35.8 42 SBP(mmHg) 120 114 200 200 Vent(L/min) 10.2 10.3 129 145 Ms BF(A)ml/min 600 555 13760 16220 CorBFml/min 260 250 900 940
Oxygen Consumption • Cardiovascular Determinants • rate of O2 transport • amount of O2 extracted • O2 carrying capacity of blood • VO2 = Q * (a-v)O2 • Exercise of increasing intensity • Fig 16-2,3,4 • Q and (a-v)O2 increases equally important at low intensities • high intensity HR more important • (a-v)O2 - depends on capacity of mito to use O2 - rate of diffusion-blood flow • O2 carrying capacity - influenced by Hb content
Heart Rate • Most important factor in responding to acute demand • inc with intensity due to Sympathetic stimulation and withdrawal of Parasympathetic • estimated Max HR 220-age (+/- 12) • influenced by anxiety, dehydration, temperature, altitude, digestion • Steady state - leveling off of heart rate to match oxygen requirement of exercise (+/- 5bpm) • Takes longer as intensity of exercise increases, may not occur at very high intensities • Cardiovascular drift - heart rate increases steadily during prolonged exercise due to decreased stroke volume
Heart Rate • HR response : • Is higher with upper body - at same power requirement • Due to : smaller muscle mass, increased intra-thoracic pressure, less effective muscle pump • Is lower in strength training • Inc with ms mass used • Inc with percentage of MVC (maximum voluntary contraction) • estimate the workload on heart , myocardial oxygen consumption, with • Rate Pressure Produce - RPP • HR X Systolic BP
Stroke volume • Stroke Volume - volume of blood per heart beat • Rest - 70 - 80 ml • Max - 80-175 ml • Fig 16-2 - increases with intensity to ~ 25-50% max - levels off • inc EDV (end diastolic volume) • high HR may dec ventricular filling • athletes high Co due to high SV • supine exercise - • SV does not increase - starts high • SV has major impact on Q when comparing athletes with sedentary • ~ same max HR - double the SV and Q for athletes
(a-v)O2 difference • Difference between arterial and venous oxygen content across a capillary bed • (ml O2/dl blood -units of %volume also used) • Difference increases with intensity • fig 16-4 - rest 5.6 - max 16 (vol %) • always some oxygenated blood returning to heart - non active tissue • (a-v)O2 can approach 100% in maximally working muscle
Blood Pressure • Blood Pressure fig 16-5 • BP = Q * peripheral resistance (TPR) • dec TPR with exercise to 1/3 resting • Q rises from 5 to 25 L/min • systolic BP goes up steadily • MAP - mean arterial pressure • 1/3 (systolic-diastolic) + diastolic • diastolic relatively constant • Rise over 110 mmHg - associated with CAD
Cardiovascular Triage • With exercise - blood is redistributed from inactive to active tissue beds - priority for brain and heart maintained • sympathetic stimulation increases with intensity • Causes general vasoconstriction • brain and heart spared vasoconstriction • Active hyperemia directs blood to working muscle - adenosine, NO - vasodilators • maintenance of BP priority • Near maximum, working ms vasculature can be constricted • protective mechanism to maintain flow to heart and CNS • May limit exercise intensity so max Q can be achieved without resorting to anaerobic metabolism in the heart • Eg - easier breathing - inc flow to ms • harder breathing - dec flow to ms
Cardiovascular Triage • Eg. Altitude study fig 16-6 - observe a reduction in maximum HR and Q with altitude even though we know a higher value is possible - illustrates protection is in effect
Coronary blood flow • Large capacity for increase • (260-900ml/min) • due to metabolic regulation • flow occurs mainly during diastole • warm up - facilitates inc in coronary circulation
CV Performance Limitation • VO2max - long thought to be best measure of CV capacity and endurance performance • Fig 16-7 • VO2 max - maximum capacity for aerobic ATP synthesis • Endurance performance - ability to perform in endurance events
CV Performance Limitation • Criteria for identifying if actual VO2 max has been reached • Exercise uses minimum 50% of ms mass • Results are independent of motivation or skill • Assessed under standard conditions • Perceived exhaustion (RPE) • R of at least 1.1 • Blood lactate of 8mM (rest ~.5mM) • Peak HR near predicted max
VO2 max and Performance • General population - VO2 max will predict endurance performance - due to large range in values • elite - ability of VO2 to predict performance is not as accurate - all have values in 65-70 + ml/kg/min • world record holders for marathon • male 69 ml/kg/min female 73 ml/kg/min - VO2 max • male ~15 min faster with similar VO2max • other factors in addition to VO2 max that impact performance • Sustained speed • ability to continue at high % of capacity • lactate clearance capacity • performance economy
Capacity vs Performance • Local muscle factors more closely related to fatigue than Q limitation • Table 6-3 correlations between ox capacity, VO2 and endurance • Lower VO2 max for cycling compared to running • Running performance can improve without an inc in VO2 max • Inc VO2 max through running does not improve swimming performance
What limits VO2 max ? • Traditional Anaerobic hypothesis for VO2max • After max point - anaerobic metabolism is needed to continue exercise - plateau • max Q and anaerobic metabolism will limit VO2 max • this determines fitness and performance • Tim Noakes,Phd - South Africa • re-analyzed data creating Alternate hypothesis for VO2max • most subjects did not show plateau bringing anaerobic hypothesis into question • Says Q not a limitation • Rather - neural and endocrine control factors reduce output before damage occurs in heart • Still very controversial - not accepted by most scholars
Inconsistencies in Anaerobic hypothesis • Q dependant upon and determined by coronary blood flow • Max Q implies cardiac fatigue - ischemia -? Angina pectoris? • this does not occur in most subjects • Blood transfusion and O2 breathing • inc performance - many says this indicates Q limitation • But still no plateau • was it a Q limitation? • Blood doping studies • VO2 max improved for longer time period than performance measures (eg 10 km time trial) • altitude - observe decrease in Q • Yet we know it has greater capacity • This is indicative of a protective mechanism
Protection Hypothesis • Noakes (1998) alternative to anaerobic hypothesis • CV regulation and muscle recruitment are regulated by neural and chemical control mechanisms • prevent damage to heart, CNS and muscle • by regulating force and power output and controlling tissue blood flow • Noakes research suggests peak treadmill velocity as a good predictor of aerobic performance • high cross bridge cycling and respiratory adaptations • Biochemical factors - mito volume, ox enzyme capacity are also good predictors of performance
Practical Aspects of Noakes Hypothesis • Primary regulatory mechanisms of Cardio Resp and neuromuscular systems facilitate intense exercise • until it perceives risk of ischemic injury • Then prevents muscle from over working and potentially damaging these tissues • Therefore, improve fitness by; • muscle power output capacity • substrate utilization • thermoregulatory capacity • reducing work of breathing • These changes will reduce load on heart • And allow more intense exercise before protection is instigated • CV system will also develop with training
Changes in CV with Training • Tables 16-1,2 - training impacts • Heart - inc ability to pump blood-SV - inc end diastolic volume-EDV • Endurance training • small inc in ventricular mass • triggered by volume load • resistance training • pressure load - larger inc in heart mass • adaptation is specific to form • swimming improves swimming • Interval training - repeated short to medium duration bouts • improve speed and CV functioning • combine with over-distance training
Cardiovascular Adaptations with Endurance TrainingTable 16.2 RestSubmax ExMax Ex (absolute) HR 0 SV (a-v)O2 0 Q 0 0 VO2 0 0 SBP 0 0 0 CorBFlow Ms Bflow(A) 0 0 BloodVol HeartVol • 0 = no change
CV Adaptations • O2 consumption • improvements depend on • prior fitness, type of training, age • can inc VO2 max ~20% • Performance can improve > than 20% • Heart Rate • training-dec resting and submax HR • inc Psymp tone to SA node • Max HR-dec ~3 bpm with training • progressive overload for continued adaptation • Stroke volume - 20% inc - rest, sub and max with training • slower heart rate - inc filling time • inc volume - inc contractility - SV
CV Adaptations • Stroke volume - cont. • EDV inc with training - due to inc left vent vol and compliance, inc blood vol, • Myocardial contractility increased • Better release and reuptake of calcium at Sarcoplasmic Reticulum • Shift in isoform of myosin ATPase • increased ejection fraction • (a-v)O2 difference • inc slightly with training due to ; • right shift of Hb saturation curve • mitochondrial adaptation • Hb and Mb [ ] • muscle capillary density
CV Adaptations • Blood pressure - decreased resting and submax BP • Blood flow • training - dec coronary blood flow rest and submax (slight) • inc SV and dec HR - dec O2 demand • inc coronary flow at max • no inc in myocardial vascularity • inc in muscle vascularity - • dec peripheral resistance - inc Q • dec muscle blood flow at sub max • inc extraction - more blood for skin... • 10 % inc in muscle flow at max • no change in skin blood flow - though adaptation to exercise in heat does occur