Download
1 / 20
200 likes | 330 Views
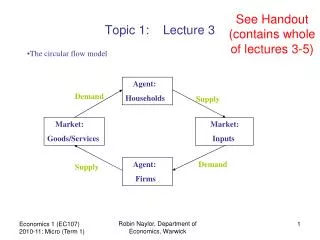
Aggregate Supply & Aggregate Demand. Chapter 11-2 Aggregate Demand. The AS/AD Model. The AS/AD model is fundamentally different from the microeconomic supply/demand model. The AS/AD Model. Microeconomic supply/demand curves concern the price and quantity of a single good.

E N D
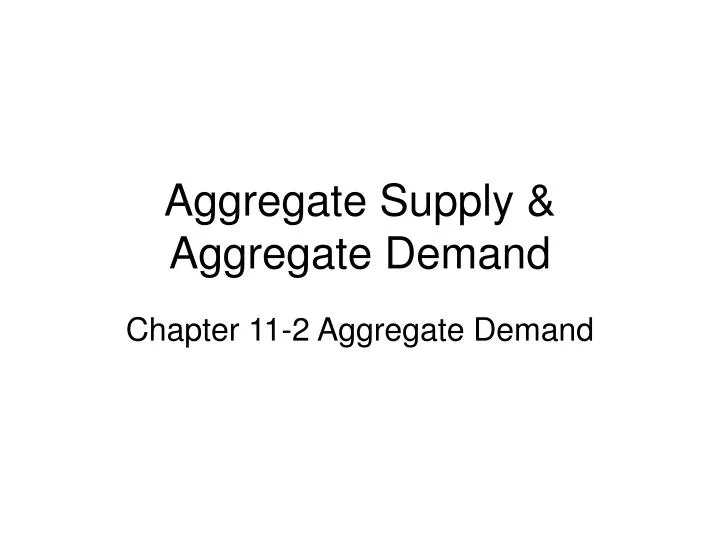
Aggregate Supply & Aggregate Demand Chapter 11-2 Aggregate Demand
The AS/AD Model • The AS/AD model is fundamentally different from the microeconomic supply/demand model.
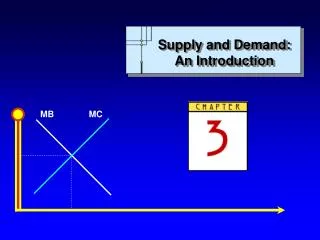
The AS/AD Model • Microeconomic supply/demand curves concern the price and quantity of a single good. • Price of a single good is measured on the vertical axis and quantity of a single good is measured on the horizontal axis. • The shapes are based on the concepts of substitution and opportunity cost.
The AS/AD Model • In the AS/AD model the price of everything is on the vertical axis and aggregate output is on the horizontal axis. • So there is no substitution
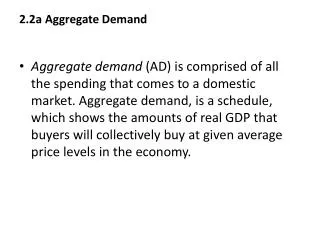
Aggregate Demand • The aggregate demand curve shows the relationship between the aggregate price level and the quantity of aggregate output demanded by households, businesses, and the government
The Aggregate Demand Curve • The aggregate demand (AD) curve shows how a change in the price level changes aggregate expenditures on all goods and services in an economy. • It shows the level of expenditures that would take place at every price level in the economy.
The Slope of the AD Curve • The AD is a downward sloping curve. • Aggregate demand is composed of the sum of aggregate expenditures. Expenditures = C + I + G +(X - M)
The Aggregate Demand Curve Aggregate Demand is the total value of real GDP that all sectors of the economy (C + I + G + Xn) are willing to purchase at various price levels. When the price level increases, (inflation), people purchase less output.
Real Balance Effect You feel poorer, so you spend less. Purchasing power declines with inflation. Interest Rate Effect Rising prices push up interest rates. Lenders need higher interest rates to compensate for eroding purchasing power of money. Foreign Purchases Effect If prices rise in the US, exports decrease and imports increase, so Xn decreases. Three Reasons why the AD CurveSlopes Down
Downward Sloping • It is downward-sloping for two reasons: • The first is the Real Balance Effectof a change in the aggregate price level—a higher aggregate price level reduces the purchasing power of households’ wealth and reduces consumer spending. • The second is the interest rate effect of a change in aggregate the price level—a higher aggregate price level reduces the purchasing power of households’ money holdings, leading to a rise in interest rates and a fall in investment spending and consumer spending
The Real Balance Effect • Real Balance Effect– a fall in the price level will make the holders of money and other financial assets richer, so they buy more. • Most economists accept the logic of the wealth effect, however, they do not see the effect as strong.
The Interest Rate Effect • Interest rate effect – the effect a lower price level has on investment expenditures through the effect that a change in the price level has on interest rates.
The Interest Rate Effect • The interest rate effect works as follows: a decrease in the price level increase of real cash banks have more money to lend interest rates fall investment expenditures increase
Shift Factors • The aggregate demand curve shifts because of • Changes in expectations • Changes in wealth • Changes in the stock of physical capital • Policy makers can use fiscal policy and monetary policy to shift the aggregate demand curve Not in this chapter but will be in future chapters
Coming Soon In the next few chapters you will see the following patterns
Government policies • Fiscal policy Tax and/or government spending AD • Monetary policy Federal Reserve money supply interest rates spending AD
200 100 AD1 Shifts in the AD Curve Initial effect = 100 increase in exports Price level Multiplier effect = 200 Change in total expenditures = 300 P0 AD0 Real output