Download
1 / 140
1.4k likes | 1.5k Views
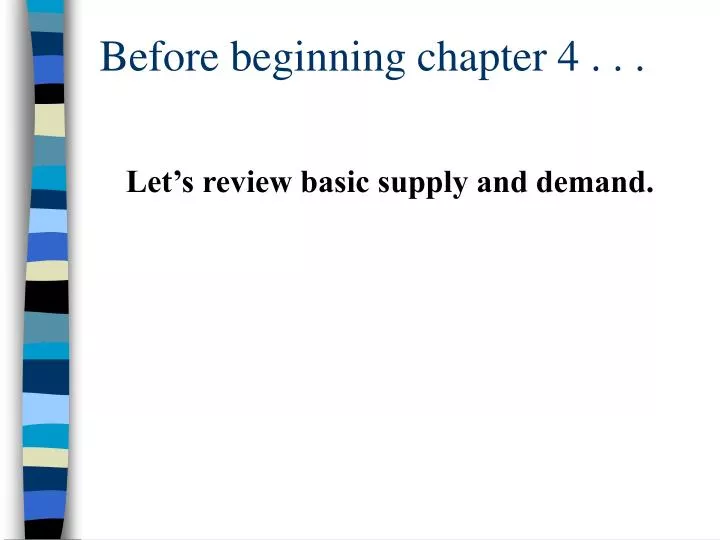
Before beginning chapter 4 . . . Let’s review basic supply and demand. Example: Graph these curves . Widget Demand and Supply. Price Quantity Quantity Demanded Supplied $20 0 100 $15 10 60 $10 30 30 $5 90 10 . You try it yourself.

E N D
Before beginning chapter 4 . . . Let’s review basic supply and demand.
Example: Graph these curves Widget Demand and Supply Price Quantity Quantity Demanded Supplied $20 0 100 $15 10 60 $10 30 30 $5 90 10
You try it yourself Widgets P 20 15 10 5 Q 10 20 30 40 50 60 70 80 90 100
Answer Widgets P 20 15 10 5 Q 10 20 30 40 50 60 70 80 90 100
At market equilibrium 10 Price is ____________ Quantity is __________ 30
Now suppose . . . that the government sets a $5 cap on the price of widgets. (A price ceiling.) There would be a ______________ of widgets. (shortage or surplus?) Copy the previous graph and show the effect of a $5.00 price ceiling. shortage
graph P 20 15 shortage 10 5 Q 10 20 30 40 50 60 70 80 90 100
Now suppose . . . that the government sets a $15 minimum on the price of widgets. (A price floor.) There would be a ______________ of widgets. (shortage or surplus?) Copy the previous graph and show the effect of a $15.00 price floor. surplus
Answer Widgets P 20 surplus 15 10 5 Q 10 20 30 40 50 60 70 80 90 100
Shifting Supply: On the graph below find equilibrium priceand quantity (draw lines to the axes and label points q* and p*. Now show the effect of an increase in Supply. P S D Q
Shifting Supply: On the graph below find equilibrium priceand quantity (draw lines to the axes and label points q* and p*. Now show the effect of an increase in Supply. P S Price down Quantity up S’ p* p** D Q q* q**
Shifting Supply: On the graph below find equilibrium priceand quantity (draw lines to the axes and label points q* and p*. Now show the effect of a decrease in Supply. P S D Q
Shifting Supply: On the graph below find equilibrium priceand quantity (draw lines to the axes and label points q* and p*). Now show the effect of a decrease in Supply. S’ P S price up quantity down p** p* D Q q* q**
Shifting Demand: On the graph below find equilibrium priceand quantity (draw lines to the axes and label points q* and p*. Now show the effect of an increase in Demand. P S D Q
Shifting Demand: On the graph below find equilibrium priceand quantity (draw lines to the axes and label points q* and p*). Now show the effect of an increase in Demand. P S price up quantity up p** p* D’ D Q q** q*
Shifting Demand: On the graph below find equilibrium priceand quantity (draw lines to the axes and label points q* and p*. Now show the effect of a decrease in Demand. P S D Q
Shifting Demand: On the graph below find equilibrium priceand quantity (draw lines to the axes and label points q* and p*). Now show the effect of a decrease in Demand. P S price down quantity down p* p** D D’ Q q* q**
What factors . . . make demand shift? make supply shift? population, income, prices of other goods, changes in tastes and preferences technology, input costs, regulations, special factors
Some word problems Some word problems give an event and then ask for the outcome in terms of price and demand of a product. Work these problems in 2 steps. First figure out what curve has shifted in which direction (e.g. Supply increase, supply decrease, demand increase or demand decrease) and then, given this change, you can figure out the change on price and quantity.
Example The price of oats decreases. What will happen in the market for rye, a close substitute? What curve shifts in the rye market? And what follows that shift? Demand for rye decreases. Price and quantity both fall when demand decreases.
ECON 2020 Dr Duffy Chapter 4
SECTION A ELASTICITY OF DEMAND AND SUPPLY
To Provide Better Analyses We need to know how much supply and demand respond to changes in price. Example: If the price of apples increases by 10%, how many fewer apples will consumers buy?
Price Elasticity of Demand The price elasticity of demand measures how much the quantity demanded of a good changes when its own price changes. It is the percentage change in quantity demanded divided by the percentage change in price.
Calculating Elasticities % Change in quantity demanded _________________________ ED = % Change in price If a 1% increase in price causes a 5% decrease in quantity demanded, what is the elasticity of demand?
Calculating Elasticities, continued % Change in quantity demanded _________________________ ED = % Change in price 5% ED ____ = = 5 1% (By convention, the minus sign is dropped on the ED.)
More Examples A 10% decrease in price causes a 5% increase in quantity demanded. 10% 5% _____ (1/2) = 0.50
Price-Elastic Demand Demand is said to be price elastic if a 1% change in price causes a greater than 1% change in quantity demanded. If demand is price elastic, ED is greater than 1.0.
Price-Inelastic Demand Demand is said to be price inelastic if a 1% change in price causes less than a 1% change in quantity demanded. If demand is price inelastic, ED is less than 1.0.
Unit-Elastic Demand When percent change in price equals percent change in quantity demanded we have unit-elastic demand. ED = 1.0
Finding the Elasticity of Demand Given two points on the demand curve, we can calculate the elasticity on the arc of the curve between them. This method is called the "arc method."
Calculating Elasticity of Demand Example Elastic Demand Price rises from 90 to 110 Quantity demand falls from 240 to 160 units. P B A D Q
Elastic Demand Example, continued How much has price increased? 110-90 = 20 To find the percentage change, divide the absolute increase (20) by the midpoint of the old and new prices, 100. Price increased 20%
Elastic Demand Example, continued How much has quantity demanded decreased? 240-160 = 80 To find the percentage change, divide the absolute decrease (80) by the midpoint of the old and new quantities, 200. Quantity decreased 40%.
Elastic Demand Example, continued ED = 40%/20% = 2. Note that the minus sign is dropped for the decrease in quantity. By convention, elasticity of demand is reported as a positive number.
Calculating Elasticity of DemandExample 2, Inelastic Demand. As price falls from $12.00 to $8.00 per unit, the quantity demanded increases from 95 to 105 units.
Percent Change in Price change $12 - $8 _________ * 100% = 40% ($12 + $8)/2 midpoint
Percent Change in Quantity Demanded change 105 - 95 _______ * 100% = 10% (105+95)/2 midpoint
Putting together the elasticity: 10% _____ ED = = 0.25 40%
Caution! If the demand curve is a straight line, the elasticity of demand does not stay constant along the length of the line!
Why not? Changes – – P __ Q/ Q K ED = --------- P/ P = – – Q Changes Q ---- = A Constant, K P
Example – – Q Q P P Q P ED 0 6 102555 10 4 10 2153 1 20 2 102 2510.2 30 0
Elasticity along a straight line Above the mid-point, ED >1 . At the mid-point, ED = 1 Below the mid-point, ED < 1
P Q/ P = 8/4 = 2 4 Q 8
P Q/ P = 8/4 = 2 4 midpoint - 2 Q 4 8
P Q/ P = 8/4 = 2 4 __ 2 - = 1 ED = 2 4 2 Q 4 8
P Q/ P = 8/4 = 2 4 3 __ ED = 2 = 3 3 2 Q 2 8
P Q/ P = 8/4 = 2 4 1 6 ED = 2 = 0.33 1 Q 8 4 6
Along a straight line Elasticity at a point is equal to the ratio of the line segments below and above that point. A BC B . ---- = ED AB at point B C
The Proof The proof relies on the geometric concept of similar triangles. The proof is available from me on request.