Download
1 / 125
1.26k likes | 1.39k Views
The Global Economy Aggregate Supply & Demand. Demand – AND supply. Problem Set #3. Answers will be posted Tuesday. Problem Set #3: Question 3. What indicators do you recommend? How is the economy doing?. Problem Set #3: Question 2. What’s happening?. Roadmap. Where we’ve been…

E N D
Problem Set #3 • Answers will be posted Tuesday
Problem Set #3: Question 3 • What indicators do you recommend? • How is the economy doing?
Roadmap • Where we’ve been… • Aggregate supply • Aggregate demand • Aggregate supply AND demand • Applications
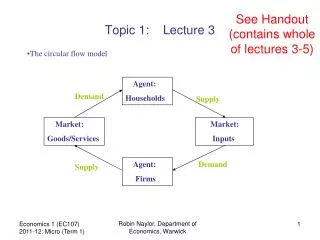
Where we’ve been… • Where we’ve been: business cycle data • Properties: some things are more cyclical than others • Indicators: procyclical and countercyclical, leading and lagging • Where we’re headed: business cycle theory • Adapt supply/demand diagram to whole economy • Examine sources of fluctuations, possible policy responses • Today: using the AS/AD diagram • Next week: monetary policy and interest rates
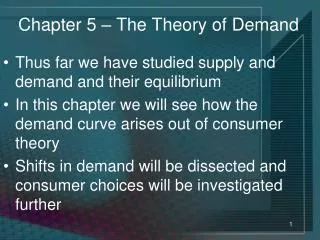
Two perspectives • Supply is what matters • If you build it, people will buy it • All we had prior to 1930 • Demand is what matters • If there’s demand, someone will build it • Response to Depression (John Maynard Keynes and others) • Paul Krugman? • What we do • Supply AND demand
Aggregate supply and demand • Adapt supply/demand diagram to whole economy • Axes • P is price level • Y is real GDP • Usually interpreted as inflation and GDP growth • Curves • Supply is about production of goods • Demand is about purchases of goods
P AS AD Y Aggregate supply and demand
Aggregate supply I • Supply is about production • Classical version [“long run”] • Production function Y = A KαL1-α • At any point in time • A is given [but may change over time] • K is given [but may change over time] • L reflects “equilibrium” in labor market • Y must therefore be “given” [and AS* vertical]
AS* P Y Aggregate supply I Y*
Aggregate supply I • Reminder: Y = A KαL1-α • Over time, what happens when these change? • A? • K? • L? • How do we represent this in the diagram?
AS* P Y Aggregate supply I Y*
Aggregate supply I • Oil prices • An increase is like a drop in TFP • Why? • Think about total payments to capital, labor, and oil producers • If more goes to oil producers, there’s less for capital and labor • Our measure of output is payments to capital and labor, so it’s gone down • If oil producers are local the lost revenue would show up there, but if they’re abroad, local output falls • That’s just like a fall in productivity: AS shifts left
Aggregate supply II • Keynesian version [“short run”] • Production function Y = A KαL1-α • At any point in time • A, K given • Simple version: nominal wage “sticky” • Increase in P reduces real wage, firms hire more workers • More L implies more Y AS curve slopes upward • Wage eventually adjusts, bringing us back to AS*
AS* P AS Y Aggregate supply II Y*
Aggregate supply: shifts • What happens to aggregate supply if we • Change A or K? • Change price of oil? • Note: both AS and AS* shift – and by same amount [the last part is a short cut, you can thank me later]
AS* P AS Y Aggregate supply II Y*
AS* P AS Y Aggregate supply: shifts Y*
AS* P AS Y Aggregate supply: shifts Y*
Aggregate demand • Basic version • Quantity theory generates inverse relation between P and Y M V = P Y P = M V / Y • Given (M,V), high Y associated with low P • What happens if M rises?
P AD Y Aggregate demand
Aggregate demand • Sophisticated version (more than we need) • Demand for money depends on nominal interest rate i M/P = Y/V(i) [= Y L(i)] • At higher interest rate, velocity higher, we hold less money • At given (M,V), high P associated with low Y (as before) • But: if we increase M, that would lead directly to higher M or P, or decrease i, which raises demand for interest-sensitive products (cars, houses, plant and equipment) • Yes, this is quick and dirty, but it’s not worth any more time
P AD Y Aggregate demand
Aggregate demand: shifts • What happens to aggregate demand if we • Increase M? • Increase G? • Increase something that changes consumption or investment demand (“confidence”? “animal spirits”?)
P AD Y Aggregate demand: shifts
P AD Y Aggregate demand: shifts
P AD Y Aggregate demand: shifts
Equilibrium • Equilibrium: where supply and demand cross • Which ones? • Short-run equilibrium • Where AS and AD cross • Long-run equilibrium • Where AS* and AD cross • Question for later: how do you get from one to the other?
AS* P AS AD Y Equilibrium Y*
AS* P AS A B AD Y Equilibrium ? Y*
Equilibrium • Start at A • At A, real wage is too high [How do we know that? Y is below Y*] • End at B – but how do we get there? • Wage too high, so let’s say it falls • That moves AS to the right until it crosses AS* at B • Wages “sticky,” not stuck forever • At lower wage, firms hire more workers, output rises
Applications • Increase money supply M • Increase government purchases G • Increase productivity A • Increase price of oil
Applications • Action plan • Start somewhere: curves (AS*, AS, AD) • Where are the short-run and long-run equilibria? • Suggest an application – which curve shifts? • What are the new short-run and long-run equilibria? • What happens to Y and P?
Application: more money • Increase supply of money • Which curve shifts? Which way? • What happens to Y and P?
AS* P AS AD Y Application: more money A Y*
AS* P AS AD Y Application: more money C B A Y*
Application: more money • Start at A: short run and long run equilibrium • More money: AD shifts right • New short-run equilibrium at B • Higher prices, higher output • New long-run equilibrium at C • Higher prices, output unchanged (!) • Why? Does this make sense to you?
Application: more money • How does this compare to our analysis of hyperinflations? • Hyperinflation • More money generates higher prices • AS/AD • Short run: higher prices AND higher output • Long run: only higher prices • What about Milton Friedman • Is “inflation always and everywhere a monetary phenomenon”?
Application: fiscal stimulus • Increase government purchases • Which curve shifts? Which way? • What happens to Y and P?
AS* P AS AD Y Application: fiscal stimulus Y*
AS* P AS AD Y Application: fiscal stimulus C B A Y*
Application: fiscal stimulus • Analysis same as previous one • AD shifts right • Short run impact: Y and P both rise • Long run impact: only P rises