Download
1 / 40
400 likes | 574 Views
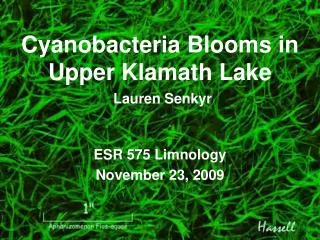
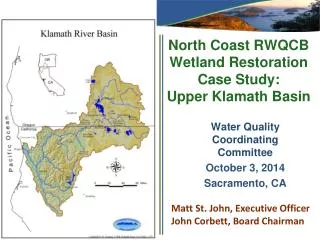
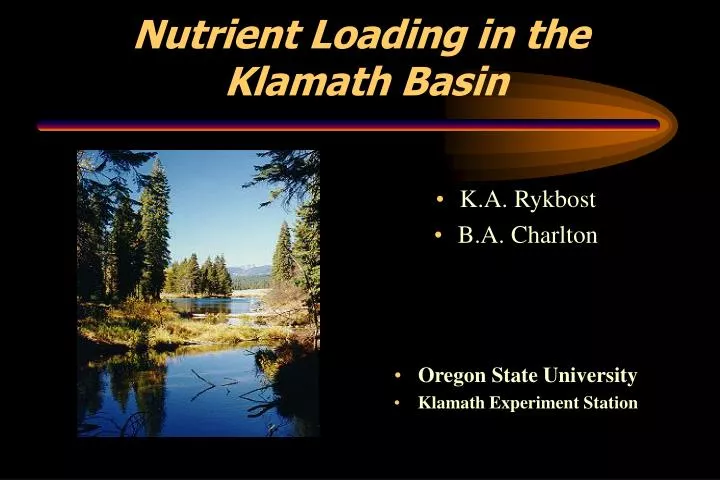
Nutrient Loading in the Klamath Basin. K.A. Rykbost B.A. Charlton Oregon State University Klamath Experiment Station. Source: USGS --- Snyder & Morace. Source: USGS --- Snyder & Morace. U.S. Department of Interior --- Bureau of Reclamation.

E N D
Nutrient Loading in the Klamath Basin • K.A. Rykbost • B.A. Charlton • Oregon State University • Klamath Experiment Station
Environmental Issues are Drivenby Political/Regulatory Forces • Federal Clean Water Act • 303D Lists of Water Quality Impairments • TMDL Process --- Oregon DEQ • Oregon Senate Bill 1010 • Private Property Agriculture Management Plans • Local Advisory Committees --- Oregon D.A. • Endangered Species Act • Listed Species --- Suckers and Salmon
Water Quality Concerns in Upper Klamath Lake • PhosphorousEnrichment supportingBlue-Green Algae (Aphanizomenon flos-aqaue) • pH > 9.0 (following algae bloom crashes) • Dissolved Oxygen below 4.0 mg/l • High Ammonia concentration (up to 0.9 ppm) • High chlorophyll – a • High temperature (up to 23C)
Lake-Wide Mean Nutrient Concentrationsin Upper Klamath Lake 1991-1998 Source: Klamath Tribes --- Kann & Walker
Major Studies of Nutrient Loadingof Klamath/Agency Lakes • Miller & Tash: USGS 1965-66 • Ag. Drainage contributes 26% of TP Inflow • Top 1” of sediment = 60 years of Inflow P • Springs in lake contribute 25% of TP Inflow • Canals contribute 5% of TP Inflow • Major rivers contribute 43% of TP Inflow
Major Studies of Nutrient Loadingof Klamath/Agency Lakes • Snyder & Morace: USGS 1993-95 • Estimated 80 tons N/year, 15 tons P/year • Monitored drainage from Ag. Lands • Noted potential for natural sources • Reported high P in artesian wells • Suggested conversions to wetlands based on loading data
Major Studies of Nutrient Loadingof Klamath/Agency Lakes • Kann & Walker: Klamath Tribes 1991-98 • Modeled Loading Data from: • Miller and Tash; Snyder and Morace • Monitored Lake-wide Nutrient Concentrations • Reported Sediment P = 61% of Load • Suggested data used as basis for retiring Ag. Land to Wetlands
Objectives of Klamath Experiment Station Studies • Determine nutrient content in background sources • Major Springs and Artesian Wells • Determine nutrient content in water flooded onto and drained from Ag. Lands • Determine nutrient loading to Klamath Irrigation Project from Klamath Lake and Klamath River
KES Water Quality Analysis Methods • All samples were grab samples -- duplicate • Samples frozen & stored for batch delivery • Kjeldahl digestion -- analyzed for: • Total P and Total Kjeldahl N • OSU Dept. of Crop and Soil Science • Central Analytical Laboratory
Phosphorus Concentration in Major Springs • Wood River Source [P] = 0.06 and 0.07 ppm • Spring Creek Source [P] = 0.08, 0.09, and 0.09 ppm • Fort Creek Source [P] = 0.06 and 0.09 ppm • Crystal Creek Source [P] = 0.07 and 0.11 ppm • Barkley Spring [P] = 0.08 ppm • Malone Spring [P] = 0.06 ppm
Well #1 Snyder & Morace 3 samples 1993-95 Total P = 6.7 ppm Total N = 6.2 ppm Klamath Experiment Station 4 samples 1998-2000 Total P = 5.3 ppm Total N = 6.2 ppm Well #2 Snyder & Morace 1 sample 1995 Total P = 2.0 ppm Total N = 8.7 ppm Klamath Experiment Station 4 samples 1998-2000 Total P = 2.4 ppm Total N = 8.1 ppm P and N Concentration Artesian WellsWood River Ranch
P and N ConcentrationArtesian Wells • Fort Klamath Area -- 230 foot aquifer • #1 (2 samples) [P] = 0.31 ppm, [TKN] = 0.25 ppm • #2 (2 samples) [P] = 0.70 ppm, [TKN] = 0.50 ppm • #3 (2 samples) [P] = 0.74 ppm, [TKN] = 0.55 ppm • #4 (3 samples) [P] = 0.75 ppm, [TKN] = 0.50 ppm • #5 (2 samples) [P] = 1.17 ppm, [TKN] = 1.13 ppm • #6 (1 samples) [P] = 1.56 ppm, [TKN] = 1.90 ppm
Nutrient Content of Inflow and Drainage from Agricultural Lands • Wocus • Snyder & Morace - 1993-95 (9 samples) • Drainage: TP = 0.21 ppm and TN = 4.2 ppm • KES - 1998-2000 (19 inflow, 24 drainage) • Drainage: TP = 0.18 ppm and TKN = 3.8 ppm • Inflow: TP = 0.13 ppm and TKN = 2.8 ppm
Nutrient Content of Inflow and Drainage from Agricultural Lands • Caledonia • Snyder & Morace - 1993-95 (3 samples) • Drainage: TP = 0.24 ppm and TN = 4.2 ppm • KES - 1998-2000 (10 inflow, 16 drainage) • Drainage: TP = 0.24 ppm and TKN = 3.7 ppm • Inflow: TP = 0.06 ppm and TKN = 1.1 ppm
Nutrient Content of Inflow and Drainage from Agricultural/Wetlands • Wood River Ranch • Snyder & Morace - 1993-95 (12 samples) • Drainage: TP = 0.96 ppm and TN = 3.0 ppm • KES - 1999-2000 (52 inflow and 32 drainage) • Drainage: TP = 0.78 ppm and TKN = 3.25 ppm • Inflow: TP = 0.17 ppm and TKN = 1.25 ppm * Note: Cattle removed in 1995
Klamath Project Plumbing • Diversions into the Klamath Project • A Canal – Out of Klamath Lake • North and ADY Canal – Out of Klamath River • Lost River from Gerber and Clear Lake Reservoirs • Klamath Irrigation Project Drain • Straits Drain from Lower Klamath Wildlife Refuge
Methods for Estimating NutrientLoading to Klamath Irrigation Project • Sample at diversions - 2 week intervals • grab samples - usually duplicate • BOR flows for midway between samples • Load = volume x concentration
Total Kjeldahl Nitrogen Loading atA, North, and ADY Canals - 1999
Total Kjeldahl Nitrogen Loading atA, North, and ADY Canals - 2000
Seasonal Mean Nutrient Concentrationsat A, North, and ADY Diversions • A Canal • 1999 TP = 0.166 ppm TKN = 2.11 ppm • 2000 TP = 0.184 ppm TKN = 2.23 ppm • North Canal • 1999 TP = 0.175 ppm TKN = 1.72 ppm • 2000 TP = 0.222 ppm TKN = 1.82 ppm • ADY Canal • 1999 TP = 0.195 ppm TKN = 1.95 ppm • 2000 TP = 0.220 ppm TKN = 1.93 ppm
Nutrient Loading Summary • KES data were well within range of observations from previous studies • Natural background sources are not limiting in Phosphorus for blue-green algae • Loading from Ag. Drainage must consider nutrients in floodwater
Nutrient Loading Summary • Nutrient concentration in Wood River Ranch drainage 80% of 1993-95 value, 5 years after cattle removed • Total nutrient loading in Irrigation Project from Klamath Lake and Klamath River • Approximately 180,000 Total P and 2,000,000 Total N • P increases from Klamath Lake to ADY Canal
Nutrient Loading Summary • Monitoring Nutrient Loading at Straits Drain • UC Davis Study • Preliminary Analysis shows P discharge = 100,000 lb • Klamath Irrigation Project • Net sink for Phosphorus including affects of municipalities and wildlife refuges
Wetland/Storage Restoration Projects • Wood River Ranch – 3,000 Ac - Wetlands • Goose Bay Farms – 2,187 Ac - Wetlands • Agency Lake Ranch – 7,123 Ac – Storage, Wetland • Tulana Farms – 4,600 acres Wetlands • Caledonia Marsh – 550 acres - Wetlands • Barnes Ranch – 2,700 Ac – Storage – Refuge?
Nutrient Loading in The Klamath Basin: Agricultural and Natural Sources Oregon Agricultural Experiment Station Special Report 1023 K.A. Rykbost and B.A. Charlton Available at: www.orst.edu/dept/kes
Questions?? • Oregon State University • Klamath Experiment Station