Download
1 / 37
380 likes | 496 Views
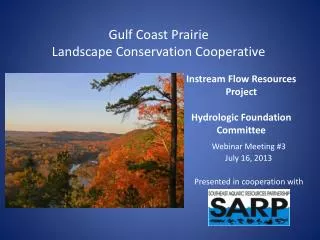
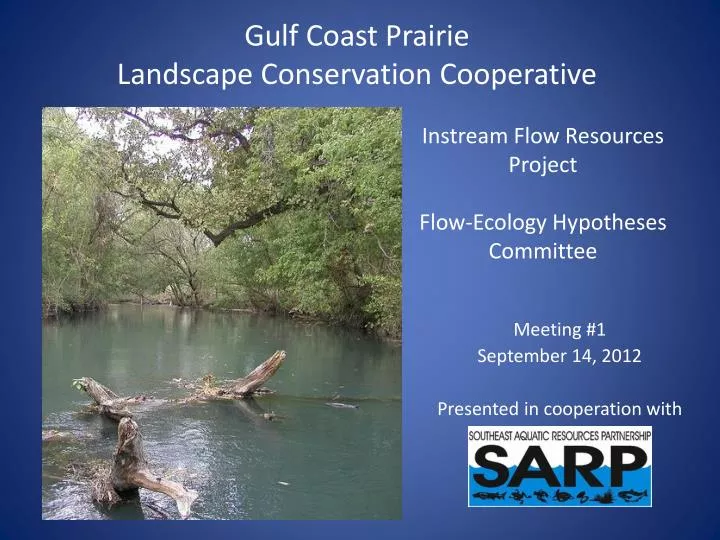
Gulf Coast Prairie Landscape Conservation Cooperative. Instream Flow Resources Project Flow-Ecology Hypotheses Committee. Meeting #1 September 14, 2012 Presented in cooperation with. GCPLCC Flow-Ecology Hypotheses Com mittee Current Membership. Shannon Brewer, Chair (OSU)

E N D
Gulf Coast Prairie Landscape Conservation Cooperative Instream Flow ResourcesProjectFlow-Ecology Hypotheses Committee Meeting #1 September 14, 2012 Presented in cooperation with
GCPLCC Flow-Ecology Hypotheses CommitteeCurrent Membership • Shannon Brewer, Chair (OSU) • Mary Davis, Facilitator (SARP) • Henry Bart (Tulane) • Prescott Brownell (NOAA) • Jacquelyn Duke (Baylor) • Kim Elkins (TNC-OK) • Bill Kelsco (LSU) • Jim Kennedy (UNT) • Robby Maxwell (LDWF) • Kevin Mayes (TPWD) • Ryan Smith (TNC-TX) • Caryn Vaughn (UO) • Kirk Winemiller (TAMU) • Others?
Meeting Objectives • GCPLCC project overview • ELOHA introduction • Use of regional Flow-Ecology Hypotheses • Alternate forms of F-E Hypotheses • Initial list of regional F-E Hypotheses • Next steps for this committee
“Hydrologic regimes are the master variables in aquatic ecosystems.” Poff et al. 1997
Ecologically Significant Components of the Flow Regime Large flood High flow pulse Small flood Streamflow (cfs) Extreme low flow Low flow Day of Year Magnitude, frequency, duration, timing, rate of change For each:
Southern Instream Flow Network (SIFN) Objective: To facilitate development of protective instream flow policies in 15 southern states by providing science-based resources and opening lines of communication.
Ecological Limits of Hydrologic Alteration (ELOHA) (Poff et al. 2010)
SALCC and GCPLCC Instream Flow Resources • Hydrologic Models • River Classification • Ecological Databases • Flow Alteration Assessment • Aquatic Conservation Priorities • Flow-Ecology Hypotheses
Risk of Flow Alteration from Impervious Surfaces Local Catchments Cumulative Impact
GCPLCC Region with EPA Level III Ecoregions
Examples of hypotheses to describe expected ecological responses to flow alteration Extreme low flow - Increased dry-spell duration in dryland or intermittent rivers will lead to reduced diversity and biomass of invertebrates and fish due to reduction in permanent, suitable aquatic habitat Low flow - Depletion of low flows will lead to progressive reduction in total secondary production as habitat area becomes marginal in quality or is lost Small floods ⁄ high flow pulses - Lessened frequency of substrate-disturbing flow events leads to shift to long-lived, large-bodied invertebrate species in non-flashy streams Large floods - Lessened frequency or extent of floodplain inundation will lead to reduced invertebrate and fish production or biomass due to loss of flooded habitat and food resources supporting growth and recruitment (Poff et al. 2010)
Regional Flow-Ecology HypothesesGuidelines • Based on responses of aquatic species and communities that are • Sensitive to flow alteration, • Widely distributed, and • Representative of a guild or habitat across a range of ecologically significant components of the flow regime (EFCs) that are amenable to management. • Narrative: who-what-when-where-how • Graphical: indicate shape of expected response curve
Meeting Objectives • GCPLCC project overview • ELOHA introduction • Use of regional Flow-Ecology Hypotheses • Alternate forms of F-E Hypotheses • Initial list of regional F-E Hypotheses • Next steps for this committee
Use of Regional Flow-Ecology Relationships Regional flow-ecology relationships will be used to inform instream flow standards and water management practices in all streams and rivers – in particular for where site-specific studies are not required.
Ecological Limits of Hydrologic Alteration (ELOHA) (Poff et al. 2010)
Flow : Ecology Response Curve Ecological Condition Increasing Hydrologic Alteration
Instream Flow Criteria 100 100% 75 80% Alternative thresholds 60 60% Ecological Condition X Y Increasing Hydrologic Alteration
Forms of Instream Flow Standards • Threshold (e.g., 7Q10, modified Tennant) • Statistical • Percent of flow (e.g., MI and FL)
Flow Prescription Percent of Flow and Seasonality of allowable cumulative withdrawals Day of Year
Michigan’s Screening Tool for Ground-Water Withdrawals Allowable cumulative withdrawal (% median August)
Presumptive Flow Standard for Environmental Flow Protection (Richter et al. 2011)
Meeting Objectives • GCPLCC project overview • ELOHA introduction • Use of regional Flow-Ecology Hypotheses • Alternate forms of F-E Hypotheses • Initial list of regional F-E Hypotheses • Next steps for this committee
Meeting Objectives • GCPLCC project overview • ELOHA introduction • Use of regional Flow-Ecology Hypotheses • Alternate forms of F-E Hypotheses • Initial list of regional F-E Hypotheses • Next steps for this committee
GCPLCC Instream Flow Project Process SARP IF Resources Local IF Resources • SARP facilitates work on top priorities through: • In-house • Partners • Contracts • GCPLCC IF Resource Workshop: • IF resource review • Research priorities GCPLCC IF Resources IF Resource Review (webinars) GCPLCC IF Research Plan Steering Committee Workshop Priorities 1 … 2 … 3 … 4 … N …
Calculation of Flow Alteration Output from The Nature Conservancy’s Indicators of Hydrologic Alteration (IHA)software
Flow-Ecology Relationships from Literature Source: McManamay et al. 2011
Integration of Flow Components Wet year Average year Dry year 4,000-10,000 cfs for 2-3 days Once every 3-5 years Channel Maintenance Riparian Connectivity, Seed dispersal Flooplain habitat Overbank Flows 700-1500 cfs for 2-3 days 2-3 X per year every year Sediment transport Lateral connectivity Fish spawning 1800 cfs for 2 days 1 X per yr every other year “Big River fish” spawning between Jul 15 - Aug 15 High Flow Pulses 300-450 cfs maintain biodiversity and longitudinal connectivity Base Flows 100-150 cfs Fish habitat 150-300 cfs Spring spawning 40-50 cfs Fish habitat 90-100 cfs Fish habitat Subsistence Flows 35 - 55 cfs Maintain water quality (35 cfs) and key habitats in May (55 cfs) JAN FEB MAR APR MAY JUN JUL AUG SEP OCT NOV DEC
Risk of environmental degradation due to flow alteration with threshold vs POF standards Low Risk of Environmental Degradation Medium Risk of Environmental Degradation High Risk of Environmental Degradation
Alternative Instream Flow Standards:threshold vs percent of flow Annual 7Q10