Download
1 / 21
210 likes | 310 Views
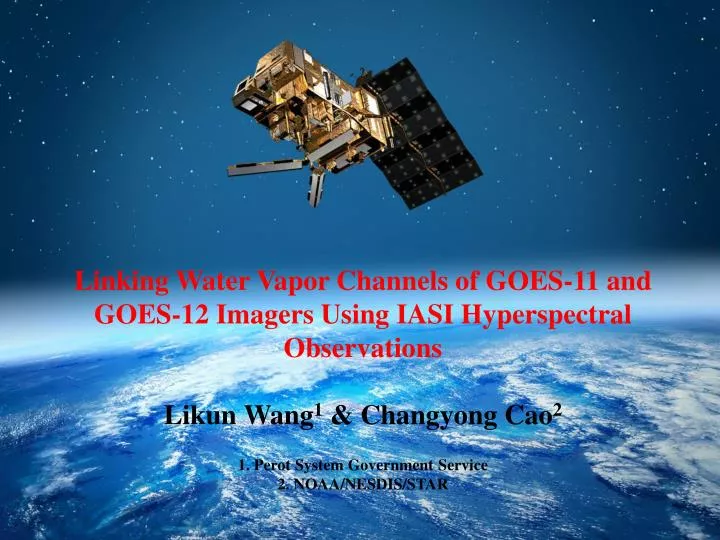
Linking Water Vapor Channels of GOES-11 and GOES-12 Imagers Using IASI Hyperspectral Observations Likun Wang 1 & Changyong Cao 2 1. Perot System Government Service 2. NOAA/NESDIS/STAR. Motivation. Global Water Vapor Composite Image from CIMSS.

E N D
Linking Water Vapor Channels of GOES-11 and GOES-12 Imagers Using IASI Hyperspectral ObservationsLikun Wang1 & Changyong Cao21. Perot System Government Service2. NOAA/NESDIS/STAR
Motivation Global Water Vapor Composite Image from CIMSS • Created from water vapor channels on operational geostationary imagers • Important products for upper troposphere water vapor monitoring 2008 SPIE
GOES-11 GOES-12 Discrepancy between GOES-11 and GOES-12 2-5 K warmer than GOES11 2008 SPIE Note that 15 minute observational discrepancy
After limb correction GOES-11 GOES-12 MOTRAN simulation for Tropical Atmosphere profile Limb correction does not help! Difference is still ~2-5 K! 2008 SPIE From liu et al. 2008
Possible Causes for Discrepancy • Radiometric calibration difference: • Both have onboard calibration: space view and blackbody view • Need to evaluate it using a common standard • Spectral response difference • GOES-12 has a wider SRF in order to improve signal-noise ratio due to the increased spatial resolution (from 8 km to 4 km) • Major root cause GOES-11 imager CH3 Water Vapor Channels 2008 SPIE GOES-12 imager CH3 From CIMSS website
Similar problems for other geostationary imagers – Spectral difference If we can link GOES-11 and GOES-12, the same method can be used to resolve the spectral differences for other geostationary imager water vapor channels. 2008 SPIE
HIRS Ch12 time series HIRS/2 10K HIRS/3 If it works for GEO instruments, the same method can be extended to LEO instruments to resolve their spectral response difference. HIRS/3 HIRS/2 2008 SPIE
Can IASI play as a transfer radiometer to link the GOES-11 and GOES-12 water vapor channels? • Launched on Oct. 19 2006 • Local Solar Time: 09:30 (descending node) • Interferometer sounder: • 645 – 2760 cm-1 (i.e., 3.6-15.5 μm) • spectral sampling interval : 0.25 cm-1 • 8461 channels • No spectral gaps IASI AIRS GOES11 &12 HIRS • Two steps: • Assessing GOES imager onboard calibration using IASI and tying their calibration to a common reference like IASI • IASI-simulations vs. GOES observations • Using a wide variety of IASI spectra to simulate GOES-11 and GOES-12 water vapor channels and find how they are correlated. • IASI-simulated GOES-11 vs. IASI-simulated GOES-12 2008 SPIE From CIMSS website
How good is IASI? IASI versus SHIS, NASTI AIRS versus IASI Water vapor absorption region 2008 SPIE Courtesy of D. Tobin and D.Blumstein Courtesy of David Tobin
Temporal and Spatial Collocation Metop-A Orbit IASI FOR GOES satellite Sub-point IASI pixel (12 km) Four IASI pixels are averaged to compare with GOES pixels (~200) falling into the corresponding IASI FOR Metop-A orbit passes the GOES satellite sub-point several times each month 2008 SPIE
Spectral Convolution R is the IASI radiance S is the GOES imager spectral response function L is the IASI-convolved GOES imager radiance i is the channel number ν is the wavenumber 2008 SPIE
Sensitivity Testing How does the BT difference vary with the scene uniformity? Stdev/Mean 2008 SPIE
Sensitivity Testing How does the BT difference vary with the observational time difference? 2008 SPIE
IASI vs. GOES-11 IASI-GOES : -0.271±0.170 K Seasonal variation of BT difference between IASI and GOES. 2008 SPIE
IASI vs. GOES-12 0.202±0.140K -0.302±0.137K GOES-12 decontamination on 07/02/07 A GOES-12 imager “decontamination procedure” was performed on 02 July 2007, where certain internal optical components were heated in an attempt to drive off contaminants that had been accumulating for several years. 2008 SPIE
The discrepancy is not caused by the radiometric calibration • GOES11 & GOES12 vs. IASI <= 0.3K at the BT range of 240-260 K with a standard deviation of ~0.2 K • The discrepancy is mostly caused by the spectral response difference. • IASI simulations can well represent the GOES imager observations. • Using IASI spectra to simulate GOES imager radiance to study SRF-difference induced bias. 2008 SPIE
Step 2: IASI-simulated GOES-11 vs. IASI-simulated GOES-12 • Using the IASI spectra to simulate the GOES-11 and GOES-12 water vapor channels • Same dataset but extend to [70S, 70N] • Nadir pixels only • One-year IASI spectra • 05/2007-08/2008 • Samples: • GOES-11: 12654 2008 SPIE
Y=1.065*X-12.714 R=0.996 Stdev (residual)=0.6 K GOES11 BT (K) BT relationship between GOES-11 and GOES-12 water vapor channels 0.6 K (~0.3%) uncertainty when one predicts the GOES-12 BT using the GOES-11 BT in the temperature range of 200-265K. 2008 SPIE
Merging observations from GOES-11 and GOES-12 water vapor channels • Limb Correction • Normalize off-nadir observations to nadir-like ones • Tying GOES measurements to IASI calibration • Adjust each instrument’s calibration to a common reference • Resolving the SRF-difference-induced observation difference • Using the linear relationship proposed in the previous slide 2008 SPIE
Before and after correction Before correction After Correction GOES-12 GOES-11 GOES-12 GOES-11 Note that 15-minites observational difference 2008 SPIE
Summary • IASI hyperspectral measurements can successfully access the calibration accuracy of narrow- or broad band instruments. • IASI hyperspectral measurements accurately resolve the observation difference caused by the spectral response difference. • IASI can play as a transfer radiometer to link the observations from different instruments to create consistent, seamless global products or time series. 2008 SPIE