Download
1 / 20
200 likes | 288 Views
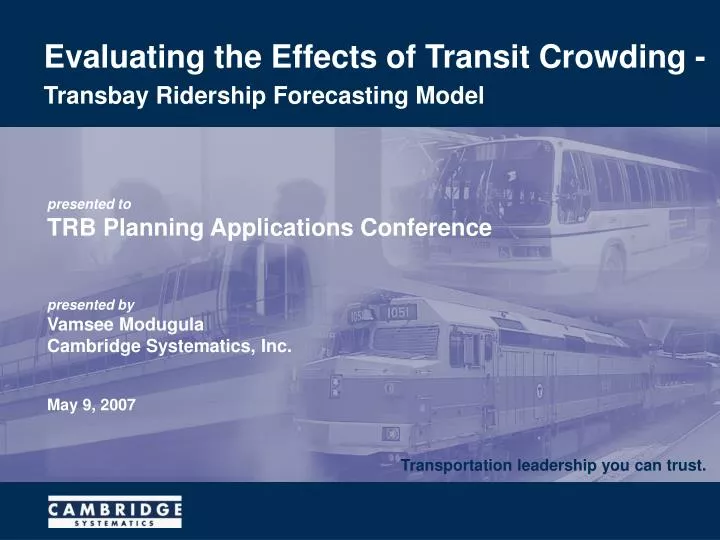
Evaluating the Effects of Transit Crowding - Transbay Ridership Forecasting Model. Transportation leadership you can trust. presented to TRB Planning Applications Conference presented by Vamsee Modugula Cambridge Systematics, Inc. May 9, 2007. Why Model Transit Crowding?.

E N D
Evaluating the Effects of Transit Crowding - Transbay Ridership Forecasting Model Transportation leadership you can trust. presented toTRB Planning Applications Conference presented byVamsee ModugulaCambridge Systematics, Inc. May 9, 2007
Why Model Transit Crowding? • Models forecast travel demand (irrespective of capacity?) • Highway models account for congestion by increasing travel time • Transit models account for parking capacity by increasing drive time to station • No direct modeling of increased wait time due to crowding • Crowding affects ridership on competing transit modes
Transbay Ridership Study - Overview • Determine future transit ridership at Transbay Terminal • AC Transit (Bus bay requirements) • Analyze the impact of capacity constraints on Transit • More accurate ridership estimates with improved travel forecasting tools • Provide analysis needed for the TIFIA loan application • Project study team included TJPA, AC Transit, BART, MTC and WTA
Innovative Features of This Project • New Mode choice model with detailed transit modes • New capability to model Transit crowding • Model passenger perception that travel time is more onerous when they have to stand or when the vehicle is crowded • Increased wait times when passengers are unable to board a crowded vehicle • Apply a range of capacity assumptions for BART • Analyse ridership and traffic volumes for Peak Hours
Better analysis of competing transit modes Traditional Method: “best path” between home neighborhood & work New Method: multiple paths” + detailed treatment of each transit option in mode choice models Full treatment of access/egress & transfers
Mode Choice Structure for the Trans Bay Ridership Model Mode Choice Motorized Bicycle Walk Drive Alone Shared Ride 2 Shared Ride 3+ Transit Walk-Access Drive-Access Local Bus ExpressBus LRT Commuter Rail BART Ferry Local Bus ExpressBus LRT Commuter Rail BART Ferry
Base year model validation - Daily Validation for the Bay Bridge
Transit crowding model • When trains are too crowded, riders can: • Wait for next train • Switch to bus or ferry • Switch to auto • Includes feedback to mode choice models • Longer travel times for riders who would experience over-crowding
Transit Crowd Modeling • Balance transit demand against capacity by applying: • In-vehicle Travel Time Adjutment
Transit Crowd Modeling • Wait Time Adjustment • Based on probability to board a transit line • Stochastic Assignment to reallocate ridership based on capacity • Trip Tables with excess demand • Trip tables with perceived travel times and actual wait times
Projected Growth in Travel in the Corridor • Growth in jobs faster than population in San Francisco County • Huge increases in commuter and total trips in the corridor • Increased Transbay Travel demand – Can BART meet demand for service
2030 MODEL – CAPACITY ASSUMPTIONS (Peak Hour Peak Direction)
Year 2030 Transit Ridership – PM Peak Hour(Low Bart Capacity Alternative)
Year 2030 Transit Ridership – PM Peak Hour(High Bart Capacity Alternative)
Year 2015 Transit Ridership – PM Peak Hour(Low Bart Capacity Alternative)
Year 2015 Transit Ridership – PM Peak Hour(High Bart Capacity Alternative)
Conclusions • This analysis did not include contraints on station platform capacity • Transit Crowd Modeling is a good way of forecasting realistic transit ridership • Assists transit operators in preparing service plans for future years.